National and Macroeconomic Overview
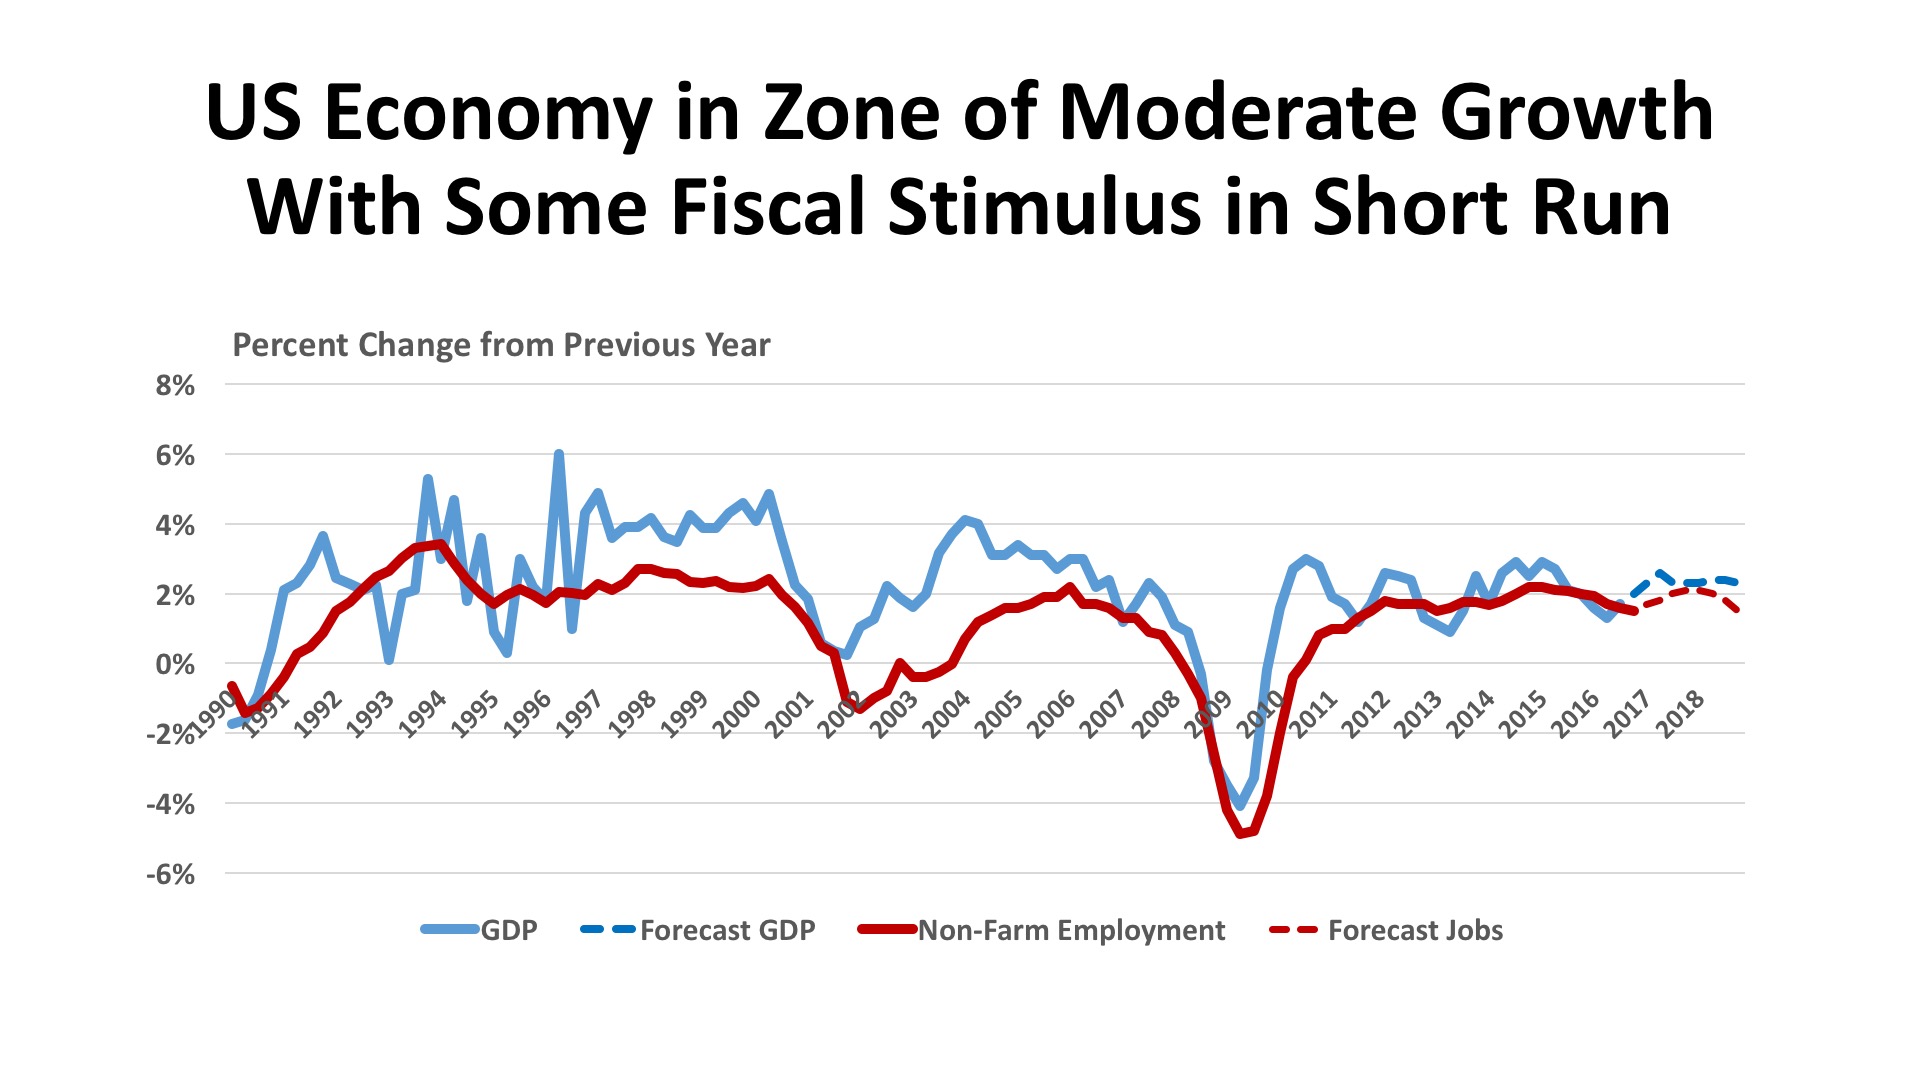
As expected, the U.S. economy accelerated in the second half of 2016 after a sluggish start that has unfortunately become a pattern this decade. The U.S. Bureau of Economic Analysis has pegged Third Quarter growth (the most recent available estimate) at a strong 3.5%, the best real performance since 3Q2014. Per capita disposable income was up 2.9% in nominal terms, and 1.9% after adjusting for inflation, a notable advance after more than a decade of sluggish gains in this measure. Corporate profits rose in the Third Quarter as well, up $50.1 billion for financial firms and $56.1 billion for non-financial companies, an improvement over earlier 2016 results in both cases. The January 2017 Federal Reserve “Beige Book” national summary indicates that economic expansion continued at a moderate pace through year-end 2016, with tight labor markets and some upward inflationary pressure. Firms and industries were said to be optimistic about growth in 2017.
Jobs. With the official unemployment rate measured at 4.7%, the economy might appear to be at full employment. But most economists understand that some slack still exists in the labor markets, with 5.6 million people employed part-time who would prefer full-time jobs and an additional 1.7 million “marginally attached” to the labor force. The labor force participation rate, which has been trending downward since the mid-1990s, now stands at 62.5%. Nevertheless, there are important signs of strengthening, not the least of which is recent wage growth. The BLS “JOLTS” report (Job Openings and Labor Turnover Survey) showed 5.5 million job opening at the end of November, with hiring (5.2 million) exceeding separations (5.0 million) that month. The “quits rate” – people leaving jobs with optimism of finding a better position – accounted for 62% of the separations. The pace of job additions slowed late in 2016, another sign that the pool of available and appropriately skilled workers is becoming somewhat shallow.
Policy. The outcome of the Presidential election signaled a potentially sharp alteration in public policy. The stock market since Election Day has signaled a belief that fiscal policy under President Trump will be stimulative in the short run, with a combination of lower taxation, lesser regulation, and Federal spending on both defense and infrastructure. The bond markets, on the other hand, are pricing an increased risk of inflation and a greater likelihood of interest rate increases during 2017. The Federal Reserve made an upward rate adjustment in December 2016, and as many as three additional moves may lie ahead in the coming year.
Outlook. Few observers are willing to hazard a detailed guess, even about near-term changes, as the incoming administration has been exceptionally vague on economic specifics and there are clear differences between 2016 campaign promises and the expressed viewpoints of cabinet nominees on key issues, including trade, healthcare, and budget balancing. The consensus of Blue Chip Economists holds its forecast as “much of the same” in 2017 and 2018, moderate growth in the range of 2.3% - 2.4% over those years.
Regional Conditions in the Western States
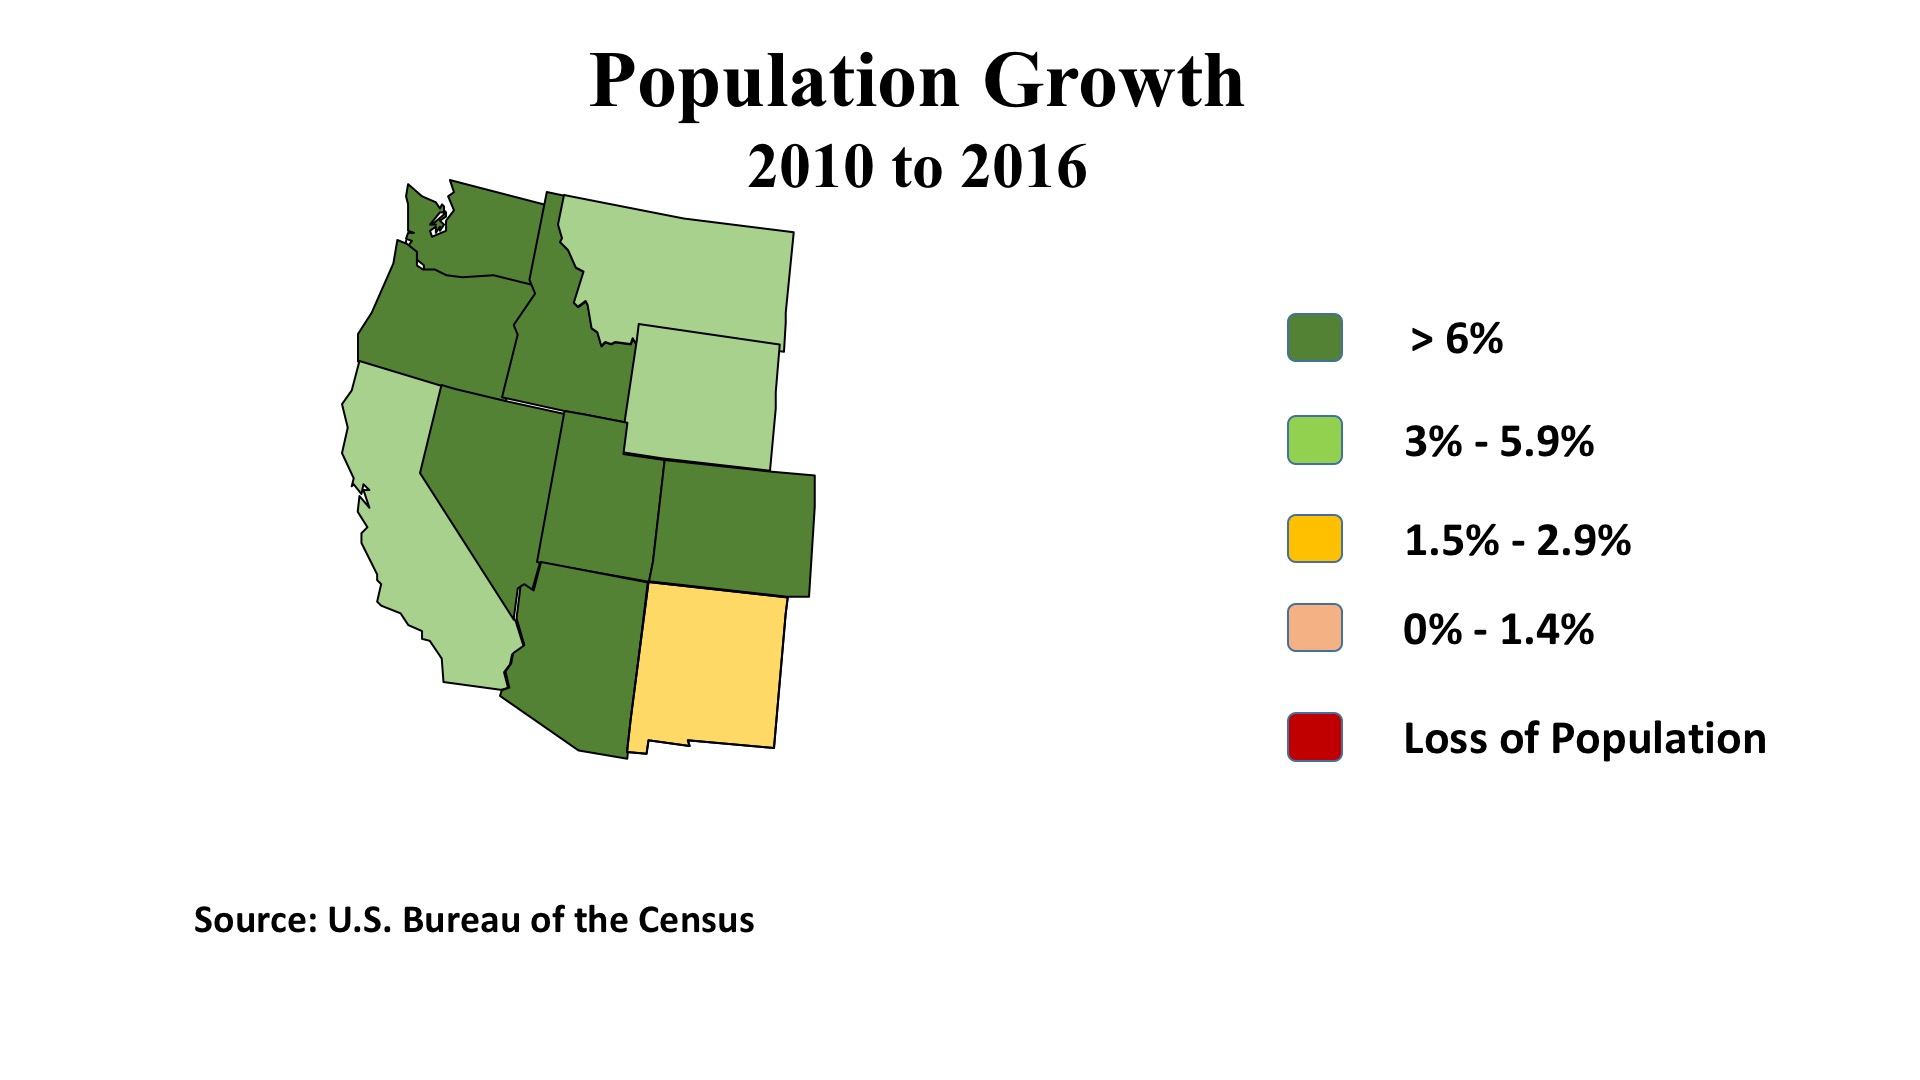
It is an aphorism that “real estate is a people business.” This refers not only to the nature of transactions, but also that property gains its value via its ability to serve the demand of the population for appropriate places to live, to work, to shop, and to recreate. Demography is fundamental to the real estate industry. The map of population growth (2010 – 2016) nicely illustrates the demographic strength of the Western region. These eleven states added more than 4.6 million residents over that time span, accounting for 32% of the entire nation’s population growth. There is a powerful reason to expect that real estate capital will respond to the evidence of such expansion.
That said, the West is the iconic region of the “wide open spaces,” or as the old cowboy song had it, “Give me land, lots of land…” Density is an issue for a majority of the region’s cities, and there is a real push/pull between the urban core and perimeters as a locus of growth. Nevertheless, this is a matter of sharing strong positive trends rather than coping with a shrinking pie. Employment statistics for the region’s metropolitan areas over the past year have been more than encouraging. Several of California’s metros are expanding significantly faster than the average 1.5% U.S. average in employment: San Jose leads the way with 3.3% gains; Sacramento (2.8%), San Francisco (2.5%), and San Diego (2.2%) follow. Although Los Angeles’ job gains measured a lower 1.7%, this was still enough to add 103,600 to its employment rolls.
Elsewhere, Denver enjoyed 3.1% growth (43,400) and Reno surged with 4.1% (8,900 jobs). Boise, another smaller metro, posted 4.2% growth (12,500 jobs). Utah’s economy is humming throughout the state: with 3.5% growth in Salt Lake City, in Provo, and in Ogden, and 4.5% in St. George in the southern part of the state. The Pacific Northwest states similarly display widespread strength, with gains of 3.1% in Washington and 2.9% in Oregon. Seattle (3.5%, 67,000 jobs) and Portland (2.6%, 29,500 jobs) are important drivers for the area, but smaller metros like Spokane in eastern Washington, as well as Salem and Bend in Oregon are posting growth rates exceeding even the impressive statewide numbers.
Fiscal stimulus at the national level should reinforce the economic expansion in the West. Investments in defense will play to the region’s strength in manufacturing materiel, including aircraft and missiles. Technology becomes a vital security tool in an era of cyberwarfare. Tax policies that can be expected to favor real estate should reinforce the trends toward population and job growth. Policy changes will, of course, not be an unmixed blessing but in the short run will tend to favor this region a bit more than in East or Central states.
Commercial Property Investment Trends
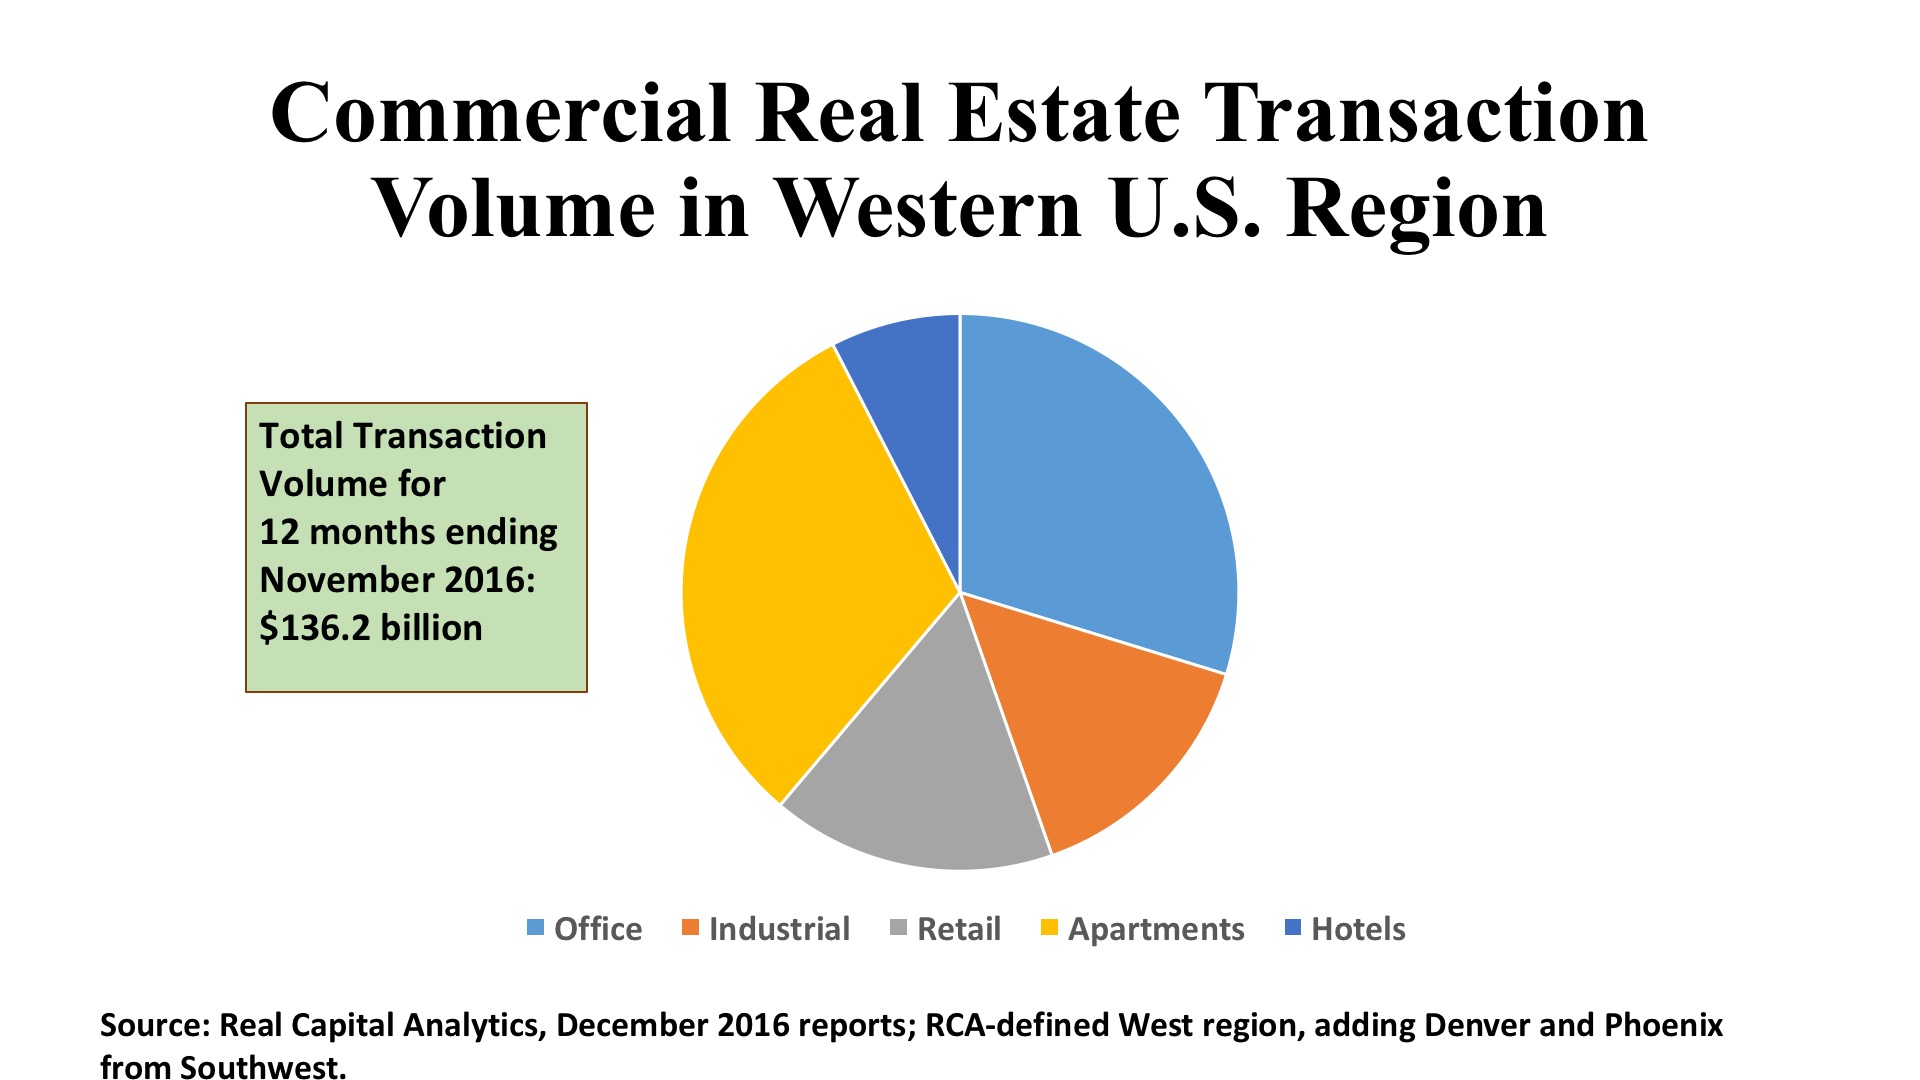
Transaction volume across the country pulled back approximately 15% in 2016, compared with the prior year. This was not necessarily a bad thing, as investment totals were approaching the pre-financial-crisis “bubble level” and there were legitimate concerns of unreasonable asset price inflations. This was especially true in the nation’s major gateway cities. While there are variations by region and by property type, the discussion which follows should be understood in the context of a market pulling back from an exuberant peak in 2015. For the West, the drop in property investment was 13.5%, slightly less than the nation as a whole, helped by a 6.8% increase in multifamily transactions to $42.6 billion.
Office. Investment in the West’s office markets was off 10.5%, to $40.5 billion, less than the declines in the East (12.3%) and Central (20.6%) regions. In large measure, the shift in volume reflects a marked preference for suburban assets during the past year. Two-thirds of the office capital flowed to suburban properties in the West, and such assets had prices per square foot ($317) that were just 73% of the price level of the region’s CBD assets. Moreover, the number of suburban deals (1,373) was more than eight times higher than those in the downtowns (165). Despite the higher share of investment, though, suburban cap rates at 6.2% were 110 basis points higher than downtown office properties. Many metros registered multibillion dollar transaction levels. Los Angeles led the region with $10.7 billion, and 89% of the activity was in its suburbs. San Francisco was a bit of an outlier, with 60% of its $6.2 billion in acquisitions in the CBD. Seattle’s $4.8 billion and Portland’s $1.1 billion were nicely balanced, with about the same shared between city and suburbs. But for San Jose ($3.4 billion), San Diego ($2.6 billion), Denver ($1.8 billion) and Phoenix ($1.7 billion) were heavily weighted toward suburban office properties.
Industrial. This sector posted the steepest investment decline over the year, dropping 31.8% to $20.2 billion, a major shock given the huge industrial markets serving West Coast ports and the sprawling distribution facilities in California’s Inland Empire. Unusually, there were more flex space transactions (556) than warehouse deals (254), the higher prices per square foot for flex space ($173) versus warehouse ($106) should have buoyed the investment totals – but there were just not enough deals to push the investment aggregate up any further. Los Angeles approached the $4 billion mark in deal volume, about twice the level of second-place San Jose. Other markets with more than a billion in industrial sales were Phoenix, the East Bay, the Inland Empire, Orange County, San Diego, and Seattle. To put things perhaps in a more favorable light, it should be noted that this region surpassed the East ($17.3 billion) and Central ($12.1 billion) in industrial investment totals for the year.
Retail. Like industrials, the shopping property sector plummeted in the West during 2016, with $22.5 billion representing a full 20% drop from the year before. Malls and smaller centers captured the bulk of retail investment, at $17 billion or three-quarters of total for this property type. Strikingly, the West trailed the East in retail investment by more than $5 billion, or 18.2%. This is not to say there aren’t some interesting stories to tell. For example, Las Vegas led all Western metros with $4.2 billion in retail real estate investment, eclipsing even the much larger L.A. market ($4.0 billion). Tertiary markets claimed $3 billion, in 290 individual retail property deals, reflecting the sprawling demography mentioned earlier. And five metros (Denver, Phoenix, East Bay, San Diego, and Seattle) each attracted more than a billion dollars apiece to the shopping sector. For 2017, it will be interesting to see how the region’s demographic and employment strength translates into investor interest for consumer-related real estate.