Overview of National Economic Context
The major macro-economic indicators. The First Quarter doldrums struck again in 2016. Relatively weak job gains in January (168,000 net new jobs for the month) were a drag on First Quarter totals, with the three-month employment increase at just 628,000. The pattern of the past several years has been economic acceleration in the Spring and Summer months. Year-over-year, U.S. employment gains exceeded 2.8 million, or 2.0%. Wages are starting to respond to the low five percent unemployment rate, with average hourly earnings up 2.3% for the year. These are “real” wage gains, as the CPI increase for the 12-months ending March 2016 was just 0.9%. Although recent increases in energy prices suggest some upward inflation to come, the US Energy Information Agency predicts that gasoline prices will average $2.04 per gallon nationally this summer, compared with $2.63 per gallon last year. That could buoy retail spending and vacation travel for consumers, which would be a welcome trend for the stores and hotels sector of the economy. The stock market gyrations certainly raised the level of nervousness across the economy. The VIX was high and the drop in the equities indexes during the first six weeks of the year was more than 10%. But since that "bottom", stock prices are up more than 15%. We are entering the Second Quarter with positive momentum.
The major policy indicators. The Fed looks like it has taken "defensive driving" courses to heart. As the central bank initiated the long-expected round of interest rate increases, the expectation was that we would see four 25 basis point bumps in 2016. The best estimate now is just two rounds of upward adjustments this year, and then only on the evidence of sustainable growth in jobs and output. During the presidential primary season, voter impatience with the domestic impact of globalization is making further expansion of free trade agreements increasingly unlikely. This could ripple through the US distribution system, especially around ports, signaling a slowdown in warehousing and logistics. Immigration is also a hot-button issue, and net inflows are down slightly since early in this decade – putting additional pressure on labor force growth. The mix of immigrants is also changing, with Asian inflows replacing Latin American as the largest source of new residents. The foreign-born population of the US, which numbered 45 million in 2015, is projected to reach 78 million by 2065, according to demographers at the Pew Research Center.
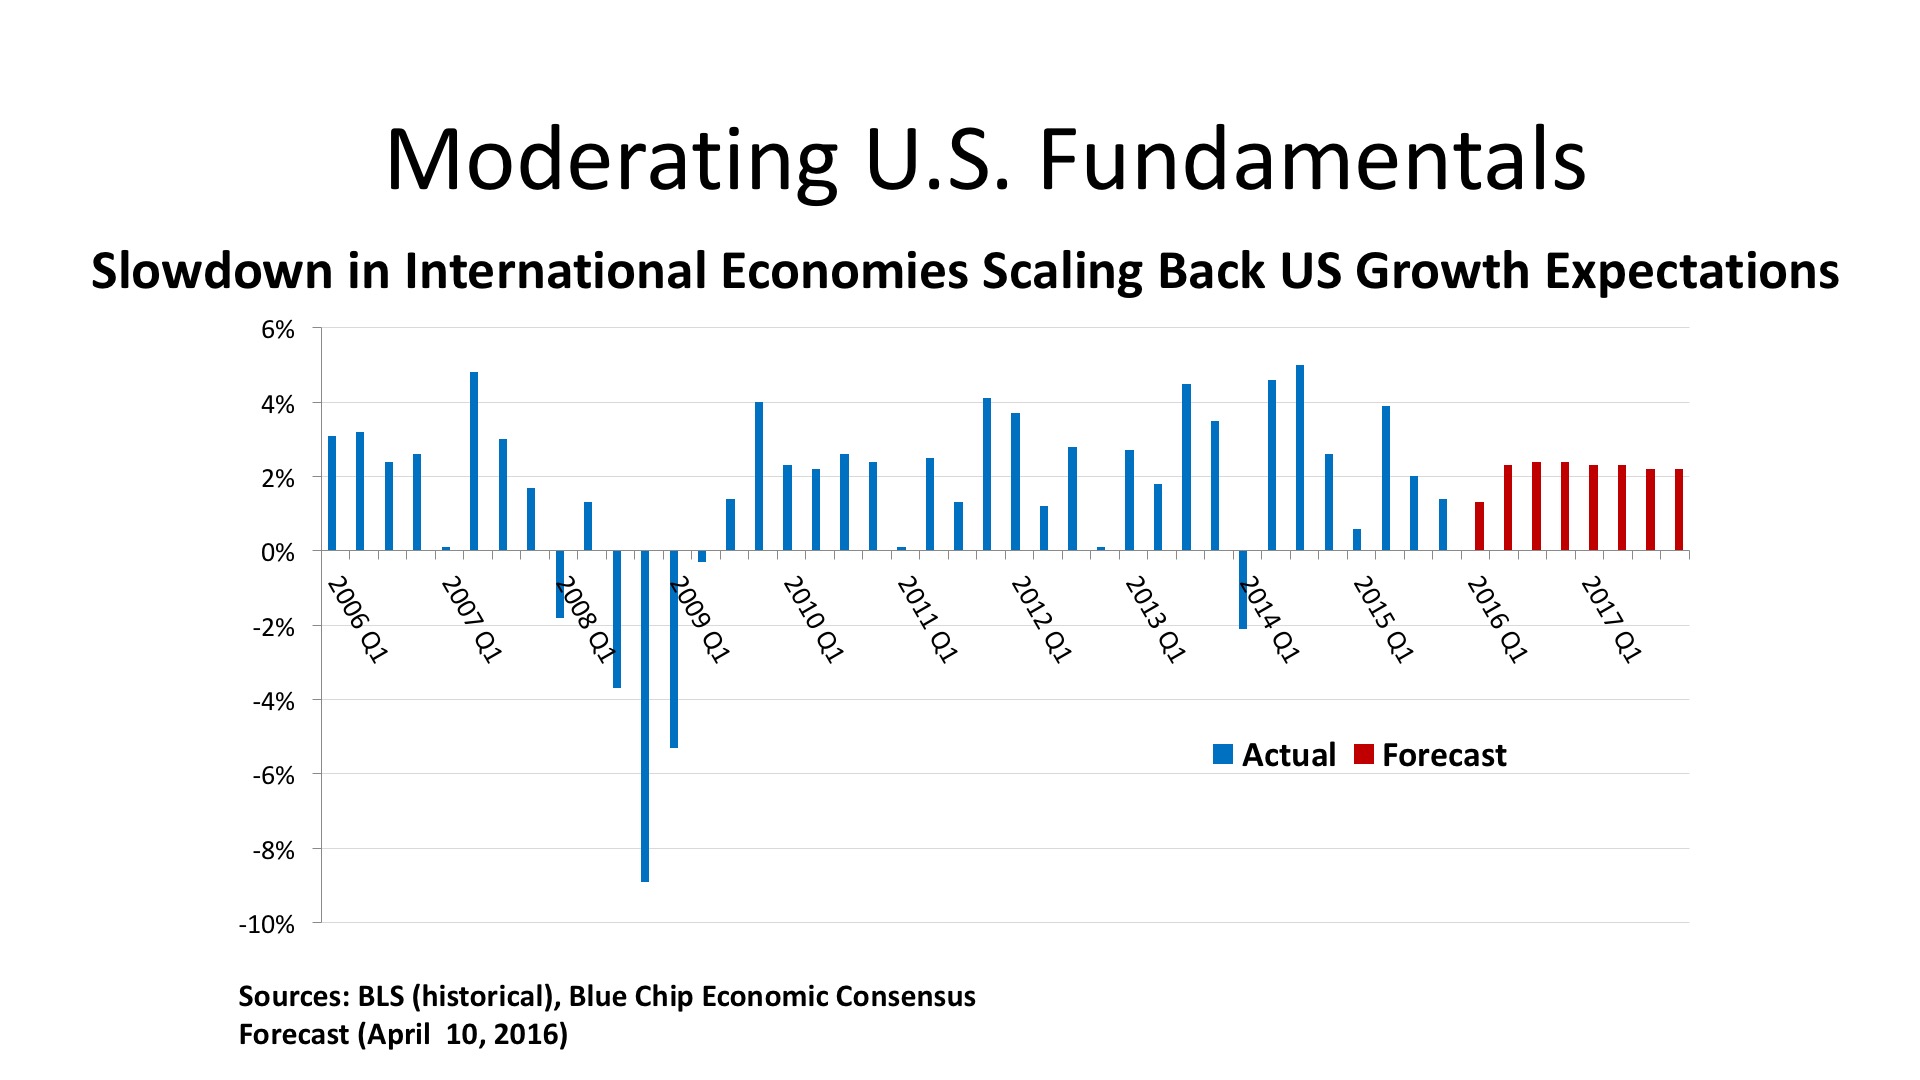
The Outlook. The Blue Chip Economists’ consensus forecast has pulled back on its growth expectations for 2016 and 2017, anticipating just a 2.0% real GDP advance this year, and 2.3% next year. Positive components going forward are moderate gains in retail spending, based upon job and wage growth, a moderate uptick in business investment as energy prices stabilize, and increases in homebuilding. Manufacturing should benefit as high levels of current inventory are reduced, but the strong US dollar is hobbling exports. Age demographics continue to constrain the labor markets, with Boomer retirements rising and Gen Y having passed its peak of labor force entry. The outlook for the unemployment rate is a reduction to the 4.5% - 4.6% range later this year and into 2017.
Regional Conditions in the Western States
Employment Trends. The eleven state Western Region outpaced the nation in job growth for the twelve months ending March 2016, adding 834,000 workers for a 2.7% employment gain. This compared with a 2.0% growth rate in jobs nationwide, giving the West a 30% share of all US job growth. This compares with its population share of 22.8%, indicating a dramatic economic acceleration in the West. Ten of the eleven states (Wyoming being the exception) posted job gains, and five of them grew at rates above 3.0 percent (Arizona, Idaho, Oregon, Utah, and Washington). California’s vast economy led in absolute job growth, with 421,000, a gain of 2.8%. The rising job market has created notable labor shortages in several states, with the unemployment rate down to 2.9% in Colorado, 3.5% in Utah, and 4.5% in Oregon.
Given the strength of the job market, wage increases are becoming more frequent, especially in the information technology sector (as well as in IT jobs in healthcare and financial services, where concerns about cybercrime have become acute). Wage increases are bolstering incomes for food service and hospitality workers, a trend that is received structure support from state and local initiatives in support of the $15 minimum wage. Reported shortages in construction labor are surfacing in the most recent Federal Reserve Beige Book surveys as well.
Macro-economic conditions. Sometimes it is worth noting “addition by subtraction,” an improvement that is occasioned by the removal of a negative condition. The strong El Nino weather pattern of the past winter did not make up the West’s water deficit, but the USDA’s drought monitor did measure a reduction in the land area in extreme drought from 17.2% in these states to 8.7% as of April 2016. So much of this relatively arid part of the country depends on water availability for demographic and economic growth that continued improvement on the environmental front is critical for sustaining its long-range success.
As we see elsewhere in the country, a housing recovery is part and parcel of a favorable economic expansion. Residential markets are tightening, and it is largely in the middle-market price range, rather than luxury homes, that the greatest gains are occurring. It is, however, a little troubling to note that credit unions in the region are reporting high volumes of subprime mortgages once again. The “sand states” in the Southwest led the nation downward by expanding into lower-quality housing loans a decade ago. This is a risky business worth monitoring closely going forward.
The goods production and distribution statistics look strong in the West. There is increased investment spending in the pharmaceuticals and electronic components industries, a harbinger of future production gains. Cargo volumes are up in trucking and rail, and airline traffic is high. All in all, the West’s job gains appear to reflect solid macro-economic fundamentals.
Commercial Property Investment Trends
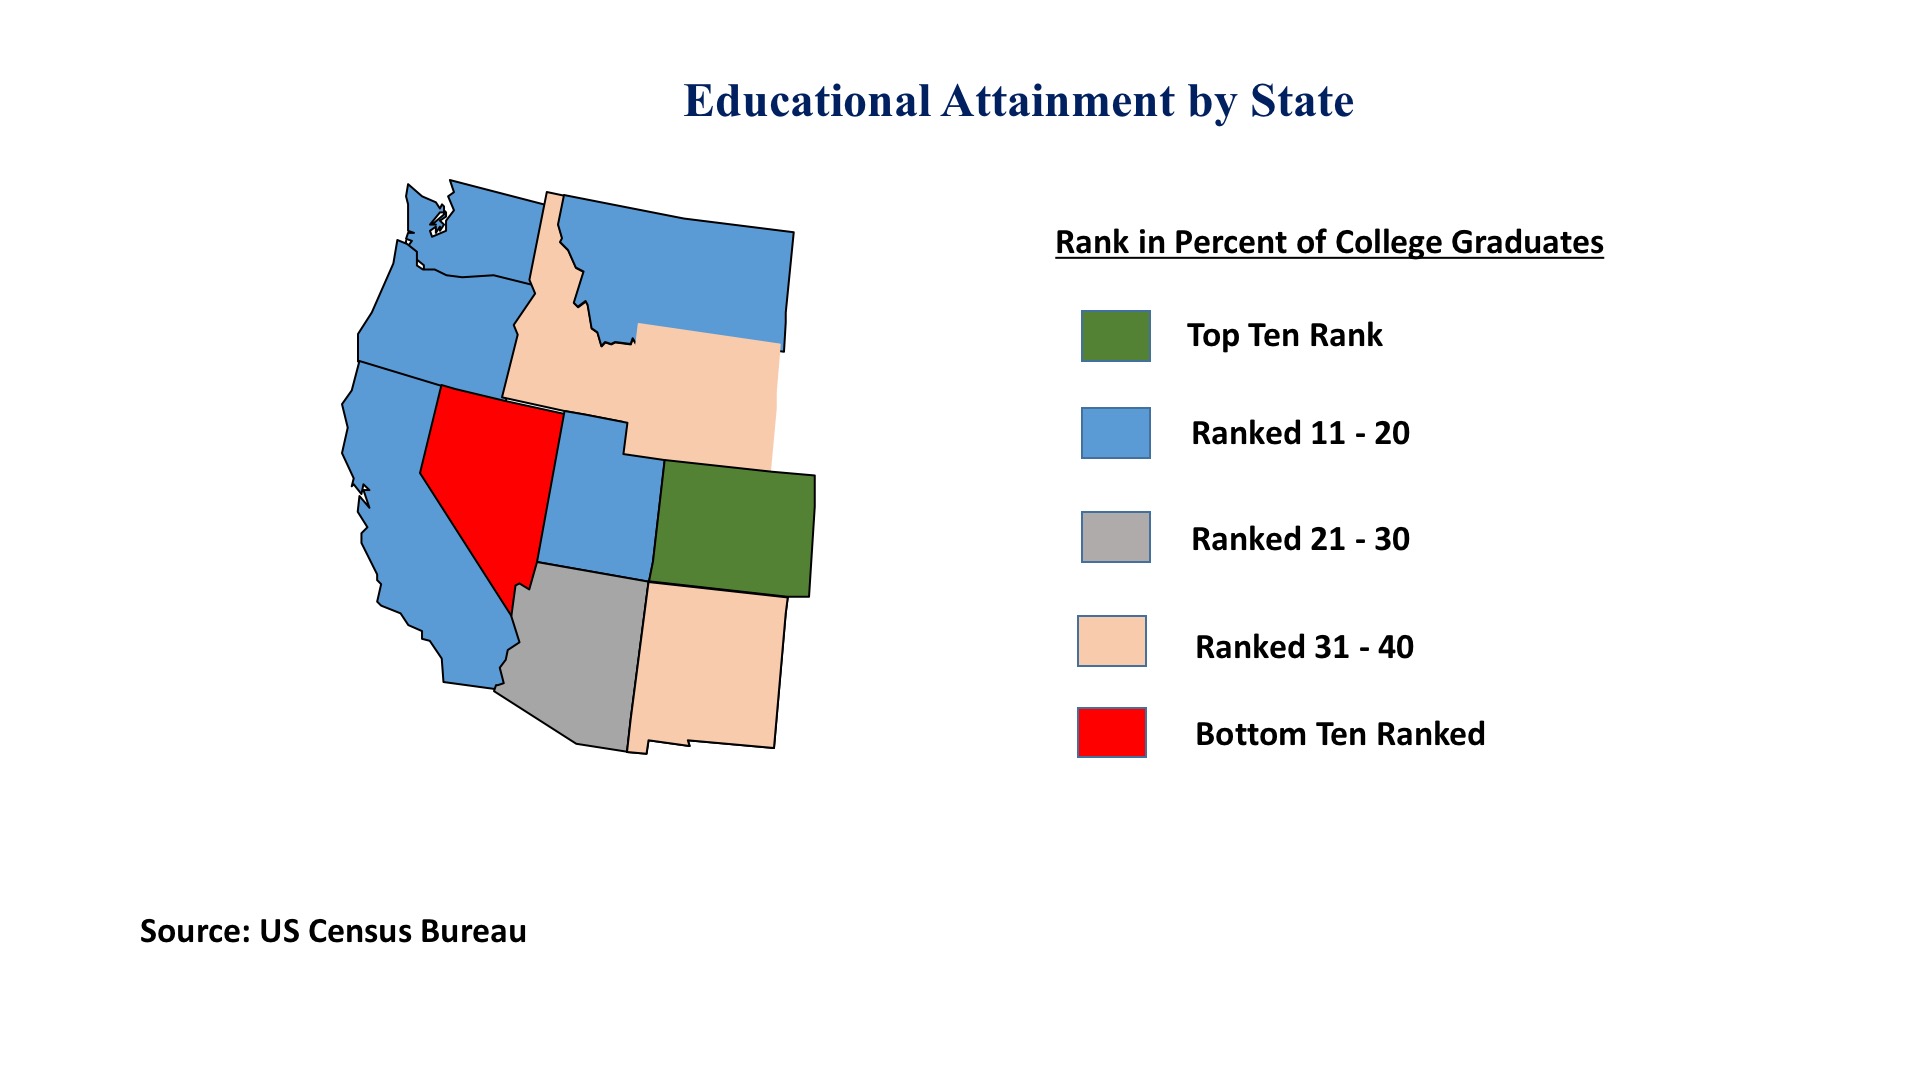
Office. With $10.1 billion in First Quarter 2016 office investment, the West captured a 32.3% share of total purchases for this property type nationwide. This far exceeds its share of population, and even its share of recent job growth. This partially reflects investor confidence in the region’s economic outlook and that, in turn, is due to its concentration of high educational attainment states, as seen in the accompanying map. The dollar volume was generated by 386 individual deals, and the strength of the capital flows pushed the average cap rate for the West down to 5.9% and the average price per square foot up to $351; the respective figures for the US in the First Quarter were 6.5% and $266.
Los Angeles, San Francisco, San Diego, and Seattle all posted more than $1 billion in office transactions in the January – March period. Denver, meanwhile, had an excellent $738 million quarter, and the East Bay market enjoyed $580 million in office sales. Eight of the nation’s 25 largest office purchases were on the West Coast, with an array of buyers including a German institutional investor, top US investment intermediaries including Heitman and JP Morgan, and tech companies like Intuit and Facebook. Recently, the Qatar sovereign wealth fund was involved in a $433 million joint venture purchase in West Los Angeles, a deal equating to $812 per square foot.
Industrials. The West posted more than $5.1 billion in industrial property transactions in early 2016, a dominant 40.7% of all purchase prices in this asset type. Sales prices per square foot were 32.2% above the US average, and the region’s average cap rate, at 6.4%, was eighty basis points lower than the US standard of 7.2%. It is an understatement to characterize the Western industrials market as having “robust” conditions in early 2016.
Transaction activity is remarkably well distributed. No single market accounts for as much as a billion in industrial property sales. But five markets saw deal volume of $400 million or higher: the East Bay, the Inland Empire, Los Angeles, San Diego, and San Francisco. San Jose ($341 million) and Seattle ($373 million) were not much below that threshold. Buyers ran the gamut of institutional investors (both domestic and offshore), logistics operations companies, and some owner-users seeking to control distribution facilities. The market appears deep (many buyers) and broad (a nice diversity of capital sources) across the 461 industrial transactions closed in the West Region in the First Quarter.
Retail. Three of the top five mall deals in the First Quarter were concluded in the West: the Eastridge Mall in San Jose bought by Pacific Retail Capital Partners for $225 million; Pasadena’s One Colorado Shopping Center acquired by Blackstone for $201 million; and the Cherry Creek Shopping Center in Denver, purchased by Invesco for $170 million. In all, eleven of the 25 largest retail deals closed in early 2016 were in the Western region.
But this was just the most visible of the shopping center investment activity, which was more characterized by hundreds of smaller deals. If we exclude the eleven largest transactions, there were still 409 retail property trades in the January-March quarter, with an average sales price of just $9.6 million. Taken in the aggregate, the West posted more than $5.2 million retail deals, 29.5% of the national volume for this property type. The regional price per square foot was $244, 30% higher than the US average of $188, at an average cap rate of 5.4%, 120 basis points lower than the national retail average of 6.6%.
In a period where many are speaking of a slowdown in commercial real estate investment, the West is emerging as a bright spot on the national scene.