National and Macroeconomic Overview
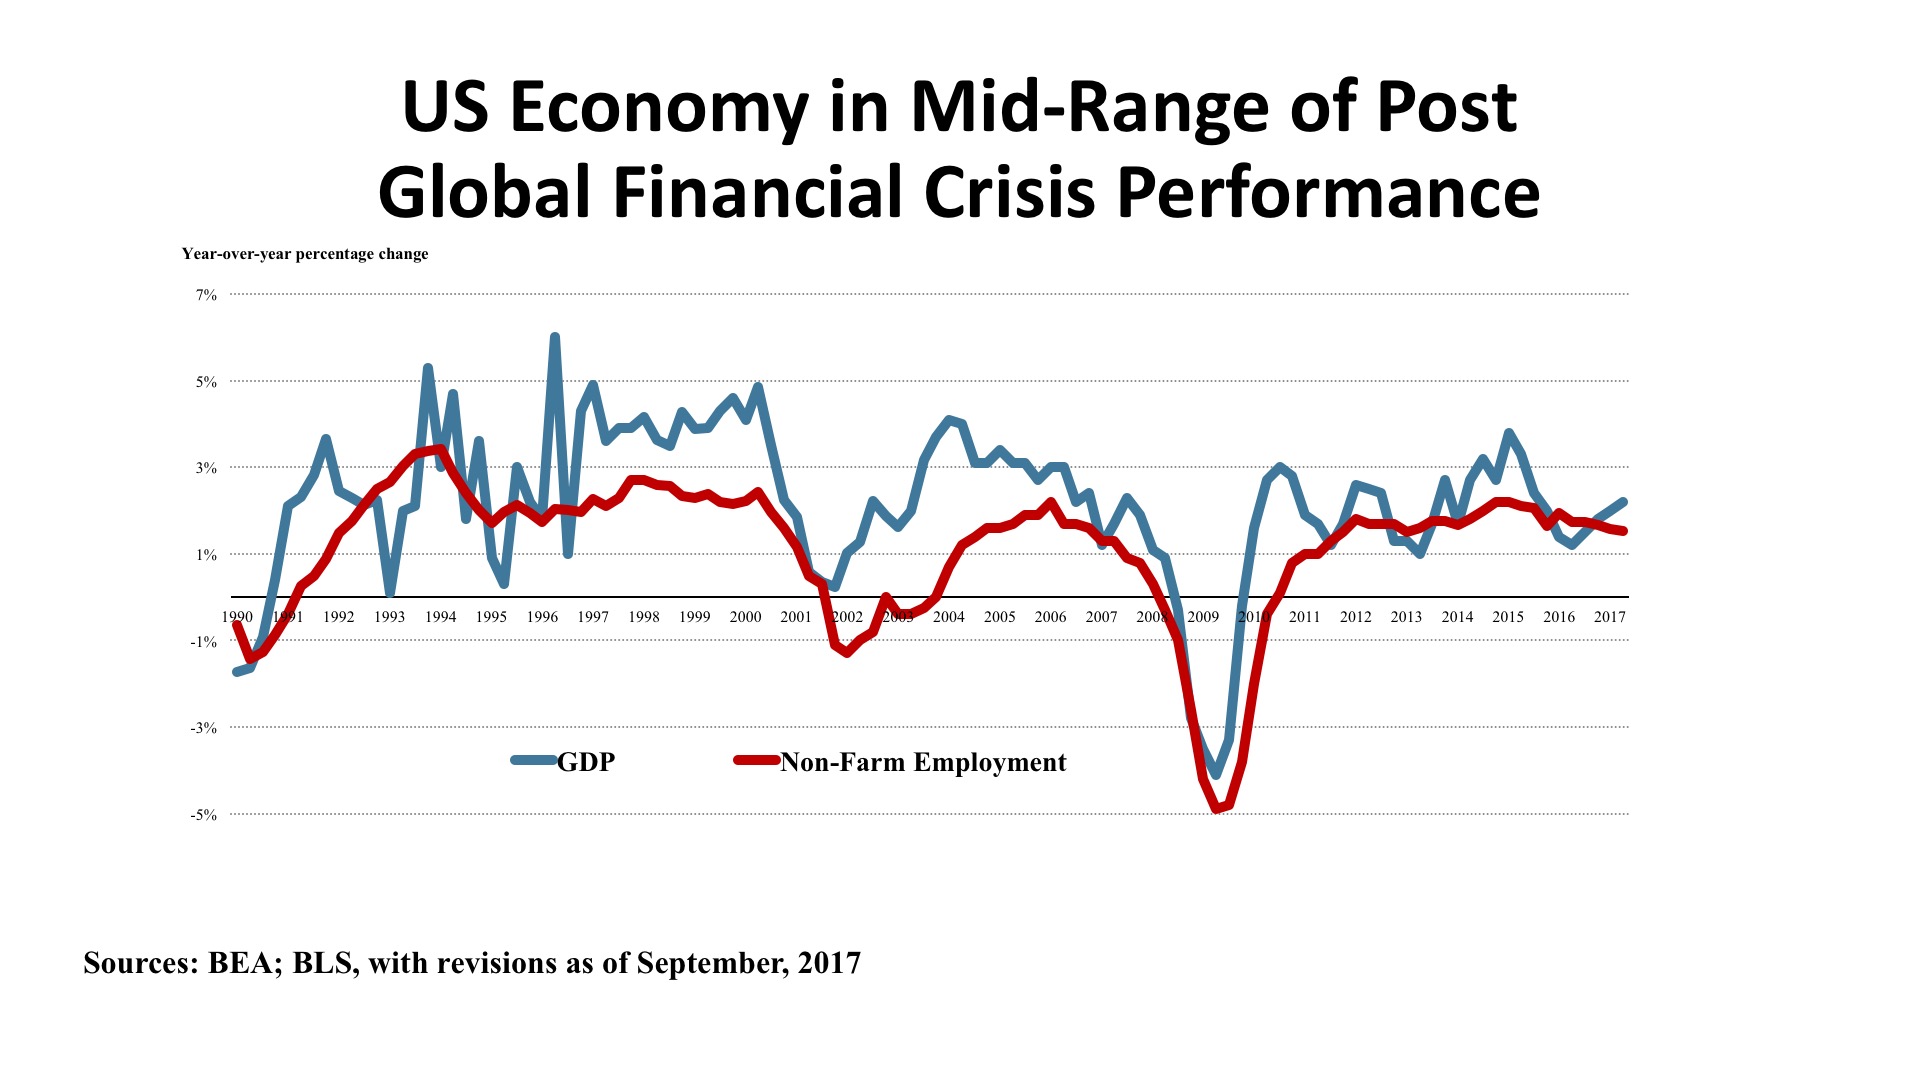
Natural catastrophes, including a devastating series of hurricanes and an intense wildfire season in the Western United States, have stressed many regions of the country during the third quarter of 2017. Nevertheless, the economy has thus far held steady within the moderate bounds of growth that have typified the recovery from the Global Financial Crisis of a decade ago. Although short-term impacts of the storms and fires will make headlines, the economy is large and resilient. It should sustain momentum with year-over-year GDP growth of 2.0% - 2.5% for both the remainder of 2017 and through 2018.
Mixed signals typify the reports from key economic sectors. Consumption, which represents about 70 percent of the U.S. economy, had a second quarter uptick as it did a year ago. In 2016, second quarter personal consumption grew at an annualized rate of 3.8 percent (up from 1.8 percent in the first quarter). This year, second quarter spending hit 3.3 percent (up from first quarter’s 1.9 percent). This pattern of a weak first quarter has frequently been seen since 2010. Existing home sales are running at 5.35 million, up just 0.2% year over year, the median home price is up 5.6 percent from a year ago. An increasing trade deficit acts as a depressant on GDP growth, and while real exports have been up 1.9% (as of August), real imports expanded more quickly at 2.8 percent.
Jobs. Nate Silver’s popular book on interpreting statistical data, The Signal and the Noise, cautions against the tendency to take one or two bits of information and extrapolating them into a presumed “trend.” So we shouldn’t make too much of the September employment report that tallied a 33,000 job loss, the first after 83 consecutive months of gains. Hurricanes Harvey and Irma impacted the market as the Bureau of Labor Statistics were collecting the September numbers, and when the October figures for U.S. Caribbean territories come in there will be an added effect measured. But recovery efforts will, later on, bolster the job picture. That’s important for the on-the-scene workers, but statistically, it is economic “noise.”
The “signal”, however, should give us deeper concern. That is the true trend, and it is measured by the now two-year-old slowdown in job growth – even before the storm impacts. Employment growth from mid-2014 until October 2015 posted year-over-year gains of two to 2.3 percent. We have not seen two percent growth since then, and average 1.5 percent for the first half of 2017. So the trend is a slow but persistent attenuation of job gains.
As we have indicated before, this is a story of increasing labor shortage caused by age demography, technological change, and a slowdown of new immigrant workers. The BLS “JOLTS” report (Job Openings and Labor Turnover Survey) showed healthcare and social services openings up 71,000, but declines in manufacturing (17,000), education (51,000), and other services (95,000). Overall, through August, the annual new hires tallied 63.8 million workers, versus 61.7 job separations, for a net gain of 2.1 million. This has been enough to drop the official unemployment rate to 4.2 percent, as of September.
Policy. Thus far, deregulation by executive order and by agency implementation has been the principal policy tool put to effective use in the first year of the Trump administration. In this, Federal policy has aligned with Wall Street hopes and expectations, extending the post-election bump well into 2017 and driving the DJIA up to 22,871 as of October 13, 2017 – or 26.4 percent higher than a year prior.
This is in contrast to the difficulties of moving fiscal policy forward by means of legislation, where healthcare reform efforts floundered, tax code changes remain at a nascent stage, and infrastructure investment has been deferred without much comment. Perhaps the President’s comment on healthcare covers the legislative agenda generally: “Who knew it was so complicated?”
As has been the case for a decade now, it is at the Federal Reserve where policy has been most effective and most transparent. Looking at the “signal” rather than the “noise,” the Fed is on a slow but steady course of tightening monetary policy, by moving interest rates gradually upward (despite still languid inflation) and reducing the huge balance sheet of assets acquired during the Quantitative Easing programs. Feeling that the markets are well-served by predictability, the Fed has been clear that its intent is to maintain a path of incremental adjustment rather than drastic policy shifts.
Outlook. There has been little change in outlook since the last edition of the TCN newsletter was prepared in July. GDP growth will fluctuate from quarter to quarter but stay in the 2.0 to 2.5 percent range on a year-over-year basis. Some upward drift in interest rates can be expected, but many are tiring of the wait for higher rates and believe it will be more than a year before the ten-year Treasury yields three percent. For the first time in decades, we may see a “soft landing” to an economic cycle rather than a hard recession. Right now, it looks like geo-political risk rather than economic dislocation is the main threat on the horizon. One variable to watch, though, is the continued widening of the incomes gap, likely to be the factor with the greatest potential to destabilize the trend of moderate upward expansion we have recently enjoyed.
Regional Economic Conditions
The short-term results of Hurricane Irma’s swath through Florida and into the Southeast are estimated at economic losses of $52 billion, including tourism losses, crop damage, and infrastructure impacts. This is slightly higher than the inflation-adjusted cost of Hurricane Andrew, which sliced across Southern Florida in 1992, and about half the cost of this year’s Hurricane Harvey in Texas and Louisiana. The Fed, while noting the serious hardships brought by the storm, considers the infusion of capital during the rebuilding period sufficient that the longer-term outlook in the affected areas will continue to see population and economic growth consistent with pre-storm trends.
Several themes have been recurring up and down the Atlantic Seaboard. Employers are reporting strong demand for labor, but insufficient supply of workers. This is not just a “high-skill” phenomenon. While shortages in technology (especially cybersecurity) and white-collar professions such as accountants are occurring, the same is also true for blue-collar workers like mechanics, truck drivers, and construction workers. Especially in the Carolinas and in Georgia, tighter immigration is creating a drag on the supply of labor, according to local economic reports.
Housing markets from New England to Florida also sound similar notes: insufficient supply, especially in homes and apartments oriented to middle-income and lower-income households. Some spot surpluses of luxury inventory – both rentals and condos – have emerged in several places from Boston to Washington, DC. Expensive housing in center cities is starting to stimulate less-costly suburban residential markets.
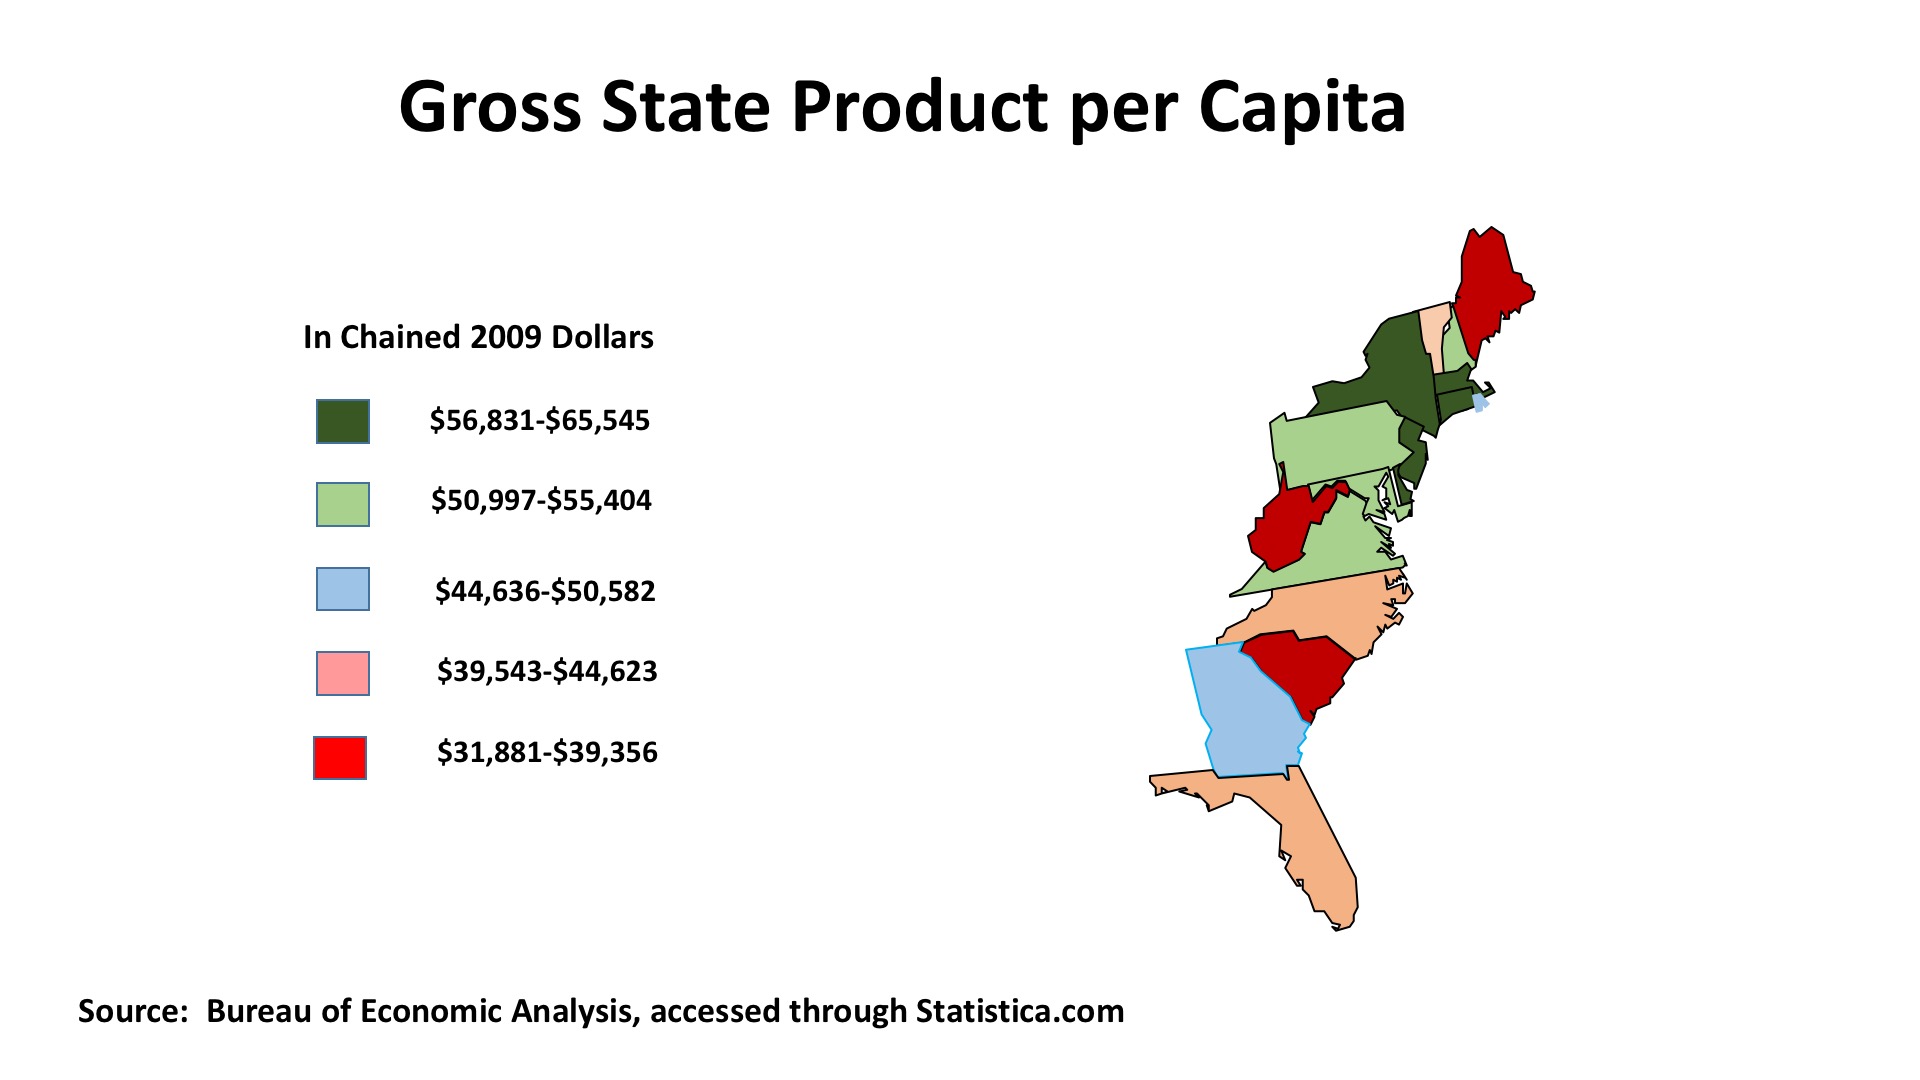
Real estate ultimately depends upon economic productivity for sustained value. The accompanying map showing State GDP per capita illustrates the economic underpinnings of property value in the states running from Virginia northward to Vermont, especially for cities in the Boston-Washington corridor. By contrast, the southeast is “economical” in its costs but this reflects GDP per capita that is below the U.S. average (as of 2016) of $50,577. Importantly, the Northeast’s economy is based on multi-industry productivity and high-density populations, rather than the resource-based states of Alaska, North Dakota, and Wyoming (sparsely populated and dependent upon just one or two economic drivers).
Commercial Property Investment Trends
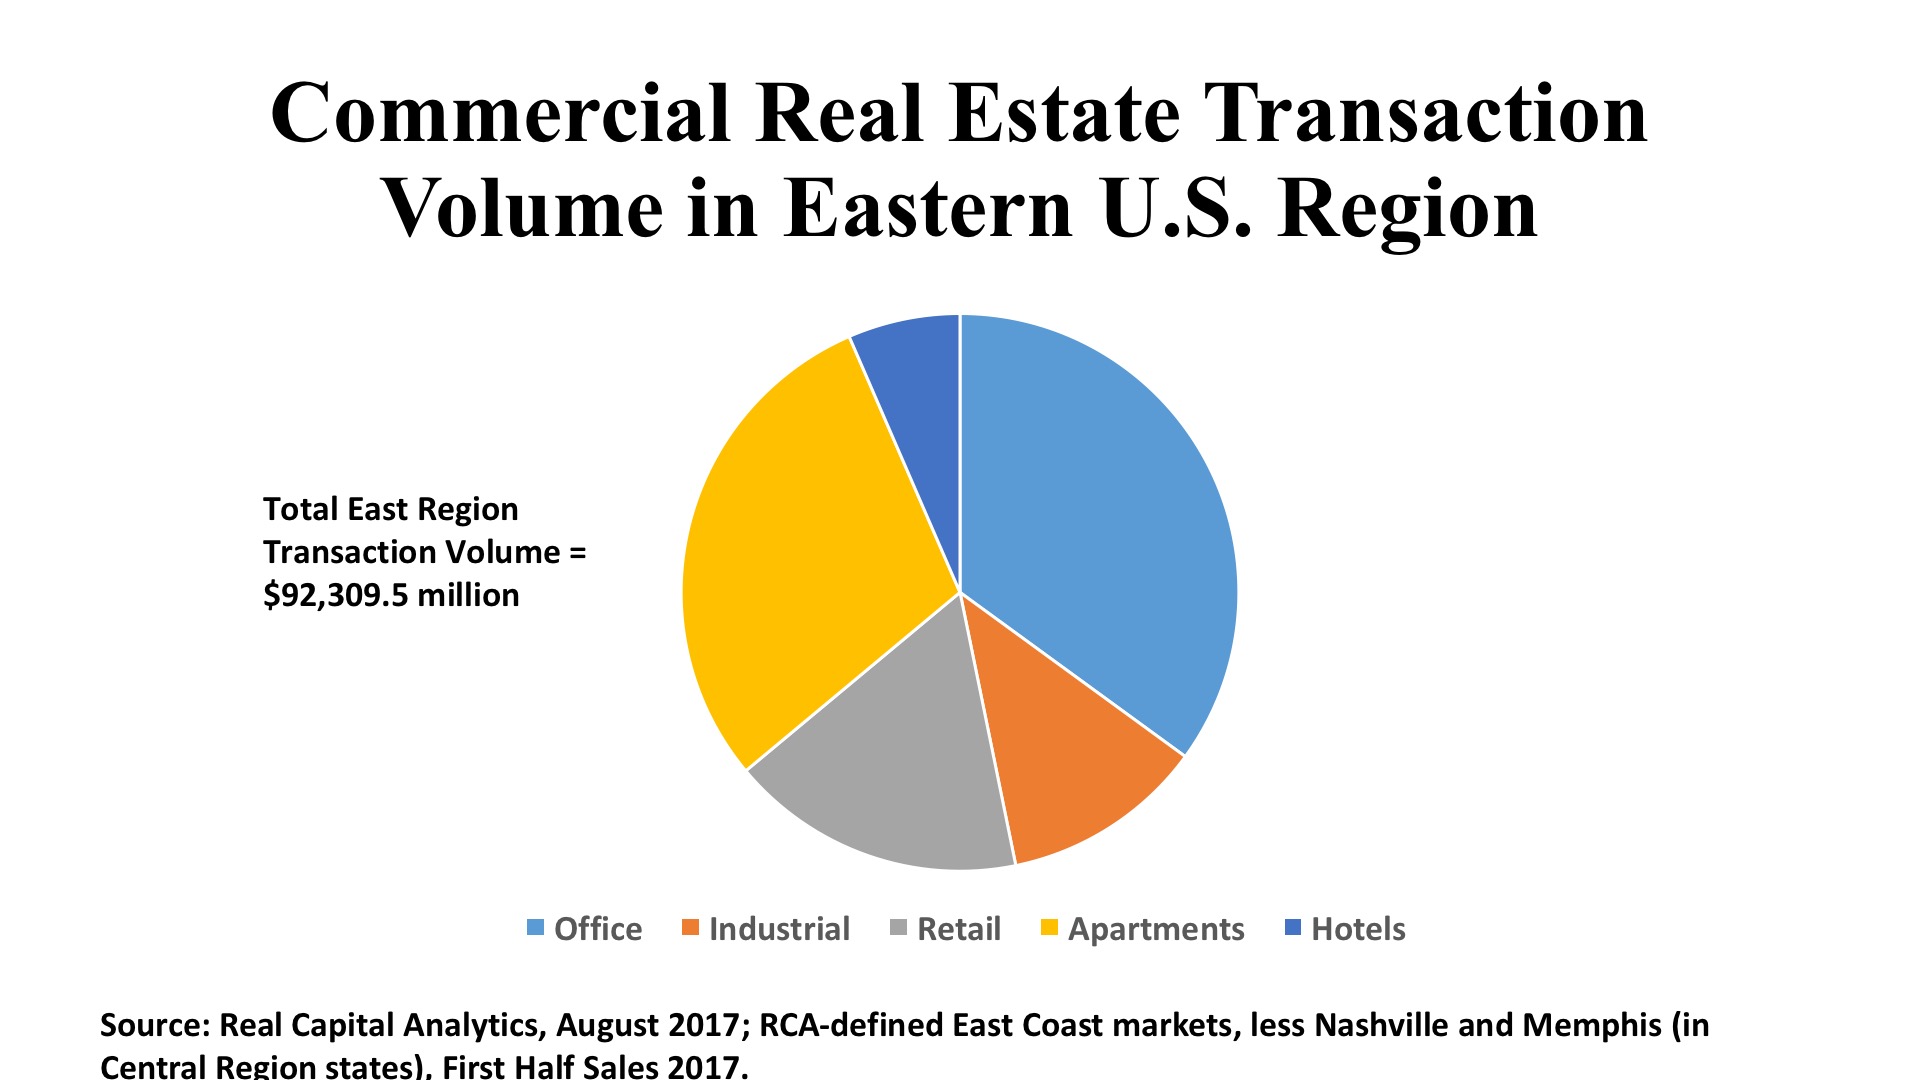
Over the first half of 2017, the Eastern region has accounted for $92.3 billion in commercial property transactions or 42 percent of the nation’s aggregate $219.9 billion volume. Investor selection varies according to locations up and down the Atlantic Seaboard. Office and retail acquisitions favor the New York, Washington DC, and Boston metros. Southeast metros like Atlanta, Charlotte, and Orlando punch above their weight in apartments, industrials, and hotels. International investors, similarly, favor the Northeast and Mid-Atlantic states, while private investors dominate transactions in the Southeast.
Office. Price and cap rate levels are shifting relative investor interest toward suburban assets in many East Coast metros, although Manhattan remains the nation’s most significant office market for deals, with $7.7 billion transacting in 47 First Half purchases at an average cap rate of 4.4 percent. Boston was also strong, with $6.1 billion in office sales with averages of a 5.2 percent cap rate and price per square foot of $519. Suburban Washington saw $2.3 billion in early 2017 office deals, equaling the volume of the CBD but with an average suburban cap rate of 6.0 percent versus 5.6 percent in the District itself. The more suburban metros of the Southeast were led by Charlotte and Atlanta, both of which saw deal volume exceeding $1.5 billion. Charlotte posted a 6.3 percent average cap rate and price of $209 per square foot, which Atlanta’s averages were 6.8 percent and $165 per square foot. In all, the East captured 47.3 percent of all U.S. office acquisition volume during the first six months of 2017.
Industrial. By contrast, it was the Southeast that led the Atlantic states in industrial property activity through the First Half of 2017. The activity was well distributed, with Atlanta seeing 120 individual industrial transactions, representing an aggregate $1.1 billion in sales price, at $54 per square foot. Charlotte and Miami/Dade each had more than fifty industrial deals apiece, tallying about a half-billion dollars for each. However, the so-called “tertiary markets” in this area were even more active, with $1.1 billion generated by 145 separate purchases, at the comparatively low price of $38 per square foot and high cap rate of 7.2 percent. The Northern New Jersey market, one of the nation’s largest, ranked highest in First Half investment volume, at $1.3 billion, with a solid 6.0 percent cap rate. New York’s “outer boroughs” continue to see industrials being purchased for adaptive reuse, both conversion to housing or office, or reconfiguration as “last-mile” distribution points for e-commerce. The $10.9 billion in industrial sales in the East was a 35.1 percent share of all U.S. transaction volume for this property type.
Retail. The Southeast also posted a whopping $8.6 billion in retail property sales, helping the Atlantic region to $15.8 billion in total stores volume, leading the nation with a 45.8 percent share for this sector. Deal volume was elevated by REIT activity, especially the Florida-based Regency Centers acquisition. REITs had more than a 40 percent share of retail property purchases in Broward, Miami, Jacksonville, Orlando, and Palm Beach. The same was true in Washington’s Maryland suburbs and Westchester County north of New York City. Despite noticeably rising store vacancies, Manhattan still attracted $1.2 billion in shopping property deals, obviously oriented to luxury at a price per square foot of $1,814, roughly ten times the national average.