National and Macroeconomic Overview
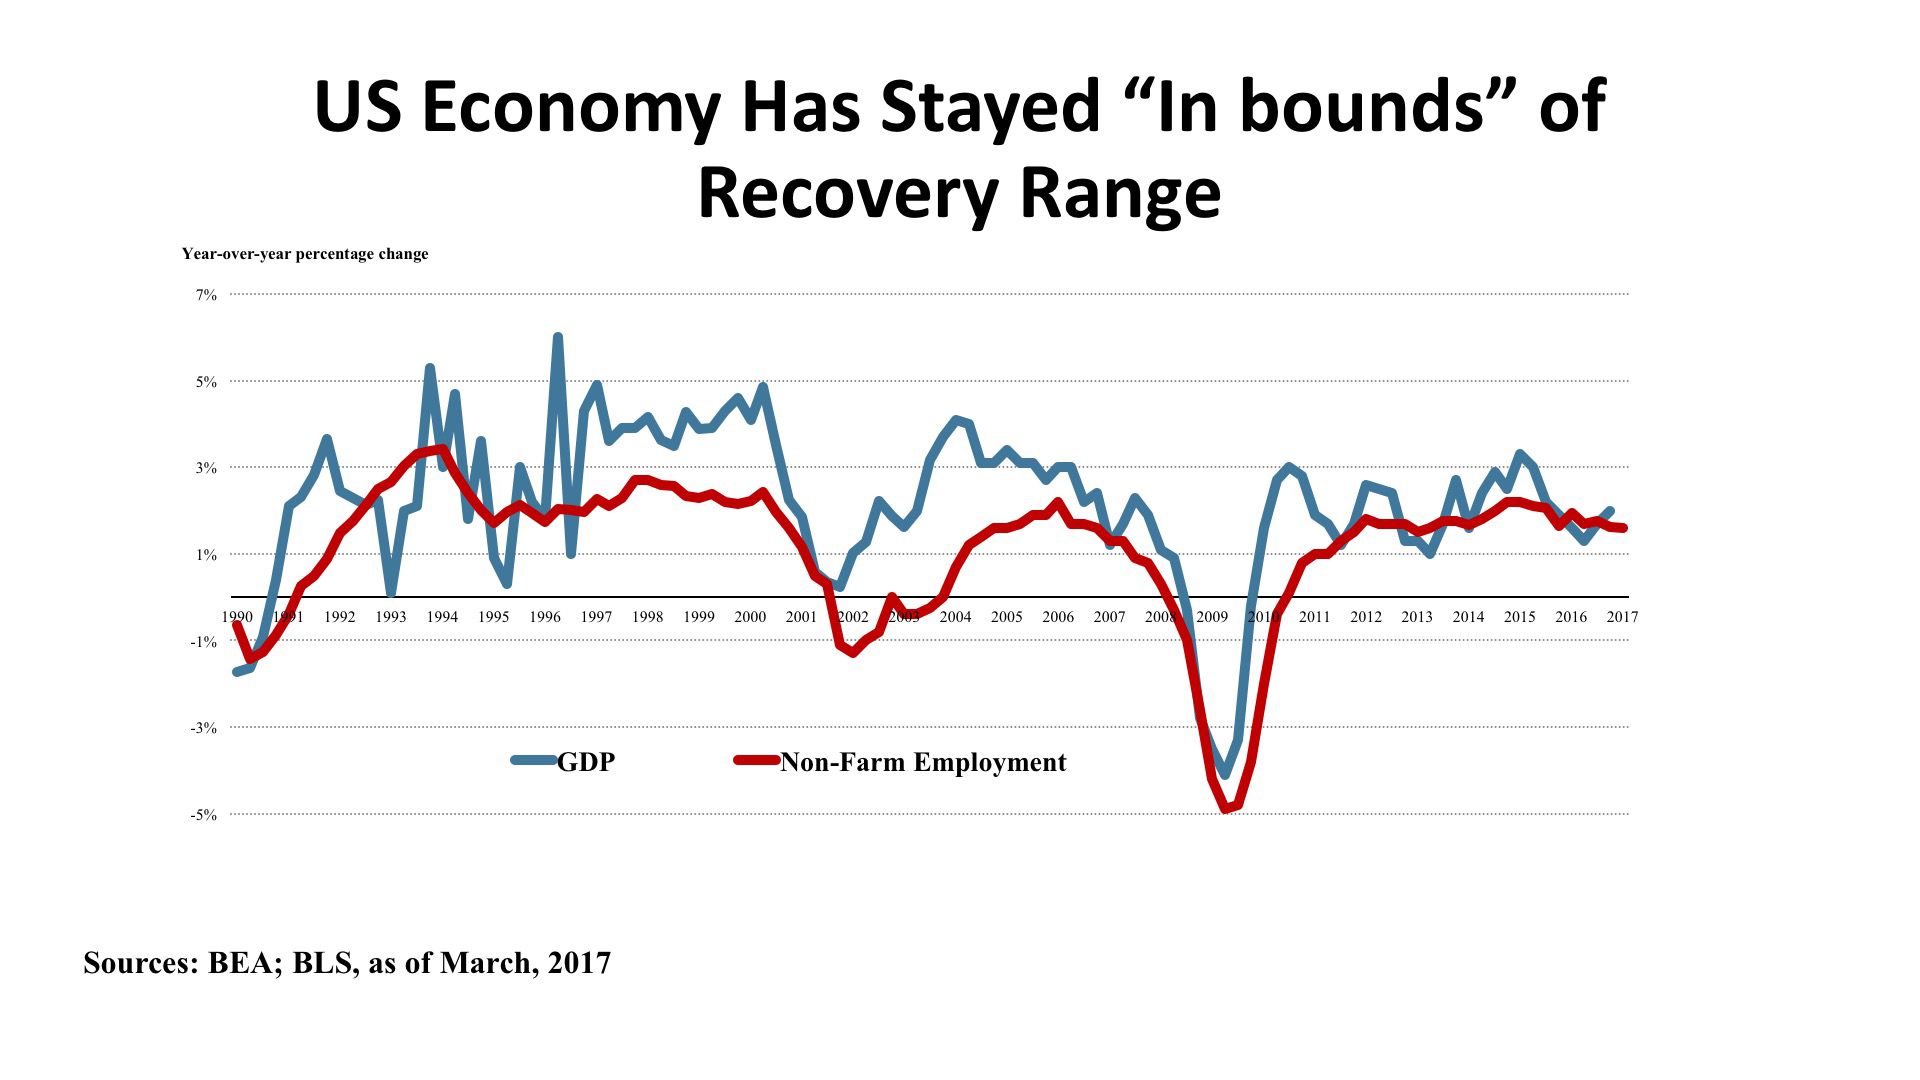
Sentiment indicators such as consumer and business confidence, stock market indexes, and surveys from trade organizations such as the Institute of Supply Managers have hit highs not seen in several years. However, most “hard data” measures have stayed stubbornly within the bounds that have characterized most of the recovery period since the Great Recession. Real consumption actually declined both in January and February. Industrial production is up just 0.4% year-over-year, as of figures released late last month, although it was utilities rather than manufacturing that showed weakness. Government press releases notwithstanding, the trade deficit is right in the range it has been since 2010. All told, then, the Blue Chip Economists’ forecast is for a meager 2.2% expansion of real GDP in 2017, followed by a scarcely better 2.4% in 2018.
Jobs. As this newsletter has been discussing for some time, demography has collaborated with the economy in putting steady downward pressure on the unemployment rate. The “headline” rate hit 4.5% in the Bureau of Labor Statistics’ most recent tally, the lowest level since 2007. There has been a saw-toothed pattern of net job growth, however, as hiring has confronted reduced slack in the labor force. We should not make too much of the comparatively weak job gain in March (98,000), but the year-over-year employment numbers have been stuck in the 2.2 to 2.4 million range for six months now, and the percentage increase March 2016 – March 2017 was just 1.5%. The numbers are hinting that the employment cycle might have peaked as early as January 2015 for this recovery. If “jobs, jobs, jobs” is the prescription for real estate demand, as for the economy as a whole, close attention to this Spring’s BLS reports is clearly warranted.
Policy. The expectation that the new Trump Administration would capitalize on its “First 100 Days honeymoon period” to advance a policy menu of lower taxes, less regulation, an infrastructure boom, and healthcare reform has met with decidedly mixed results. Executive orders have indeed loosened regulatory constraints, and a strongly stimulative Defense Department budget will provide a boost to many parts of the country (see this issue’s map for detail, and the regional economic discussion below). But the American Health Care Act fizzled without making it to a Congressional vote – hobbled by opposition from both the right and left, and doomed by a Congressional Budget Office analysis showing as many as 24 million losing coverage. Tax reform will not be easier (it never is). The infrastructure outlook depends upon appropriations that seem wholly dependent upon the budget implications of the as-yet uncertain tax bill. Monetary policy, meanwhile, appears to be on a long-awaited course of Fed tightening in a move away from the zero-interest-rate bound of 2009 – 2016. Policy coherence remains in short supply, in other words, and may remain so until some spirit of compromise arrives in Washington.
Outlook. The consensus of Blue Chip Economists for moderate growth in the range of 2.2% - 2.4% in 2017-2018 is actually slightly weaker than three months ago. Unemployment is expected to stay low, but inflation is now expected to edge upward and exceed the Fed’s two percent target, and possibly rise above 3% briefly during 2017. Wages can be expected to tick upward under these conditions, and households’ disposable income would improve. Bond rates will be rising – increasing business borrowing costs and constraining investment. And home mortgage interest rates will likewise increase, taking some steam out of the housing recovery. So the outlook is mixed, but risks to the downside are increasing.
Regional Economic Conditions
Led by California and the state of Washington, the West has enjoyed a solid start to 2017. Competition for both skilled and unskilled workers is producing wage gains in sectors ranging from construction, to agriculture, to information technology. Retail sales are displaying steady growth, even with the shift from in-store to on-line consumption. Vehicle sales and grocery retailing had a notable First Quarter. Demand for business IT services, including cloud computing, Big Data applications, and mobile devices is generating occupancy demand from those industries. Manufacturing is producing mixed results: positive in semiconductors and aircraft, but fabricated metals and branded pharmaceuticals weaker. Interestingly, restaurants are seeing a pullback in customers, as are hotels. Local sources attribute this to immigration scrutiny discouraging both the documented and undocumented alike from previous levels of economic visibility.
This is such a vast region that generalizations are bound to disguise more local differences. For instance, only four states in the West (California, Washington, Colorado, and Wyoming) have per capita incomes (PCI) above the national average. Utah’s is low but has been rising nicely since 2010. Arizona and New Mexico have low PCIs, which have stayed flat since 2011-2012. However, Idaho and Nevada not only have low incomes but have seen declines in recent years. Income inequality is a regional phenomenon, as well as a feature of households and of cities.
Employment gains in the Western states have totaled 622,000 over the past 12 months, or 26.5% of the overall US gains. This is, surprisingly, lower than either of the two other major regions of the country. Almost half of the employment increase was in California (303,000, up 1.9%), with Washington ranking second with 85,100 new jobs (up 2.7%). On a percentage basis, Utah (3.3%), Idaho (3.4%), and Nevada (3.1%) added jobs at rates much higher than the US norm. Nearly all of Arizona’s new jobs have been concentrated in Phoenix. In Nevada, Las Vegas and Reno are both seeing strong growth. While California’s major markets are all expanding, it is worthwhile to point out the even faster rate of growth in the Central Valley and in the Inland Empire. Elsewhere, secondary cities like Boise, Portland, and Salt Lake City are enjoying above-average job growth.
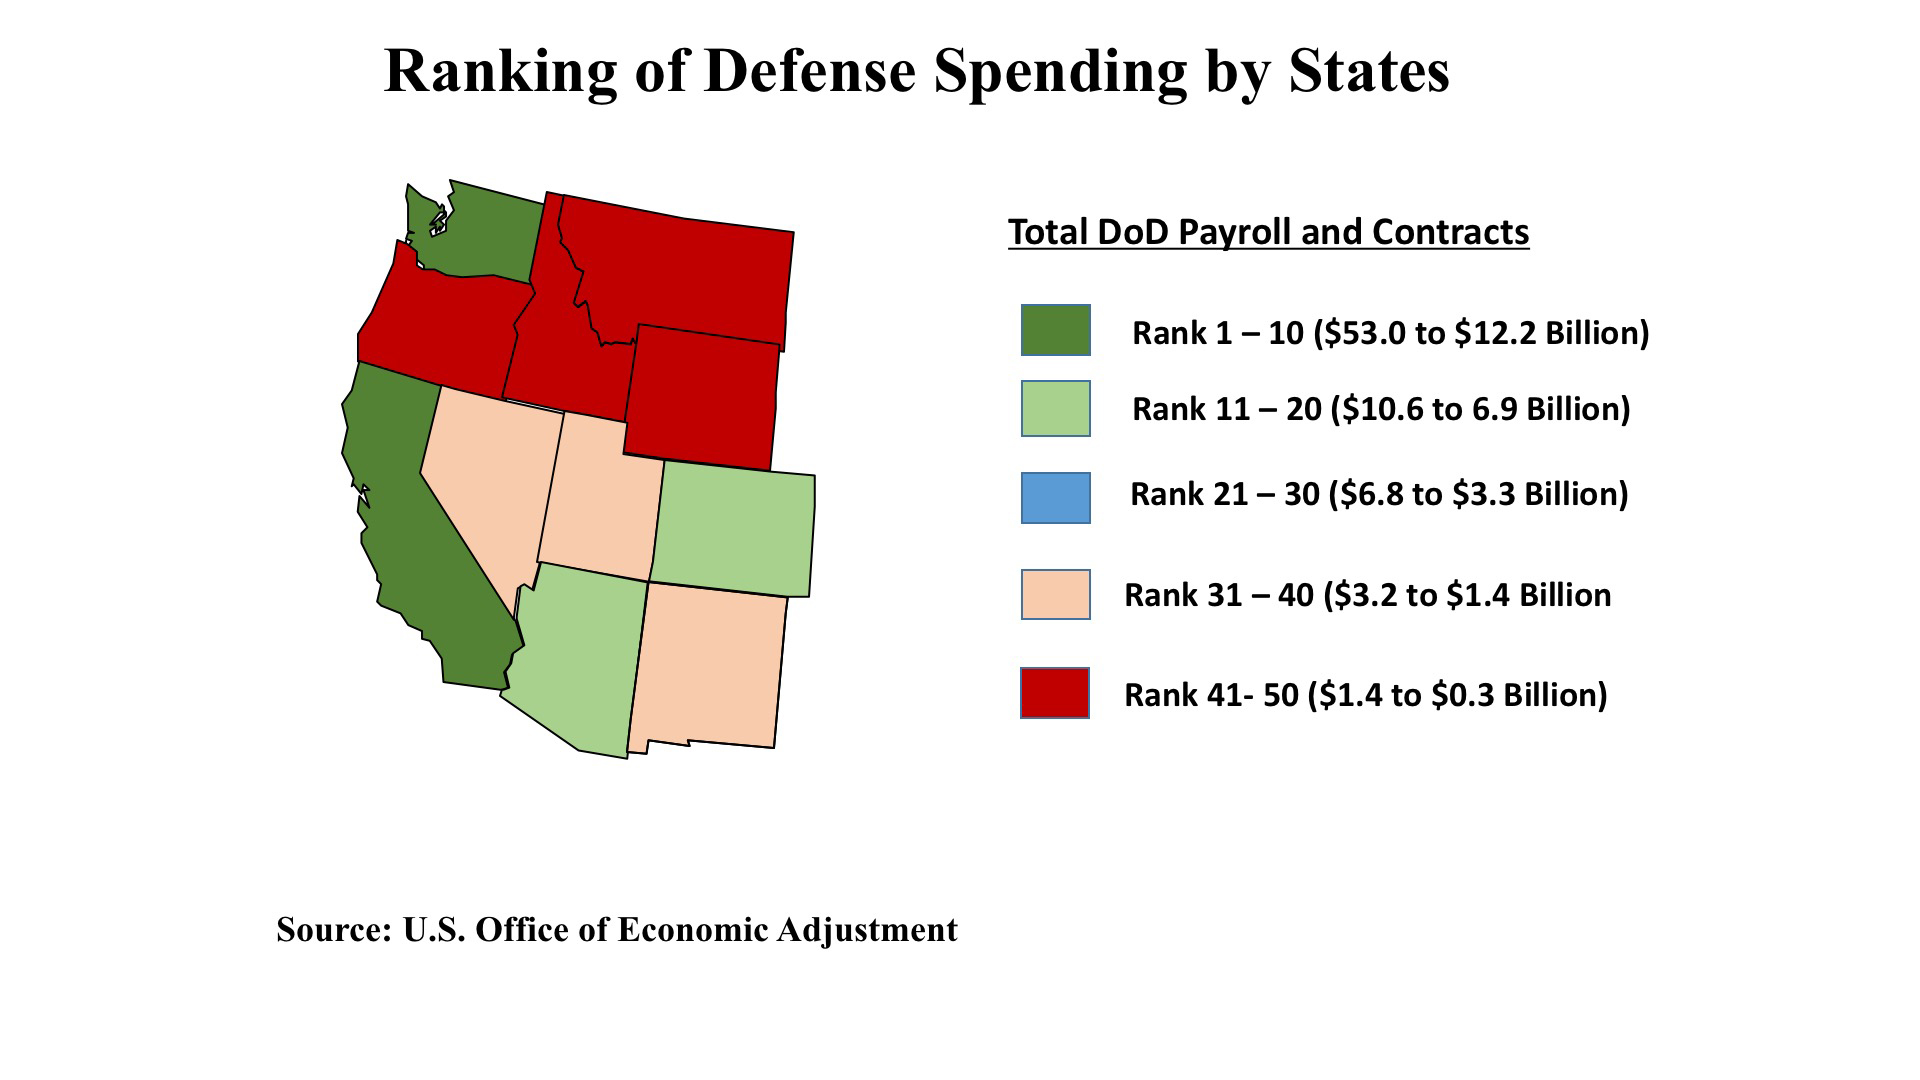
Stimulus from the increases in Defense Department payroll and contracting will likely bolster California and Washington, two states already relishing an economic boom. Colorado and Arizona also stand to benefit, and the multiplier effects in these states can be significant. Washington, Colorado, and Arizona already have defense spending well above the US norm on a per-capita basis, as well as in absolute dollars while California stands very close to the national average. States shown in deep red on the accompanying map, on the other hand, should not expect this particular form of Federal stimulus to help locally.
.
Commercial Property Investment Trends
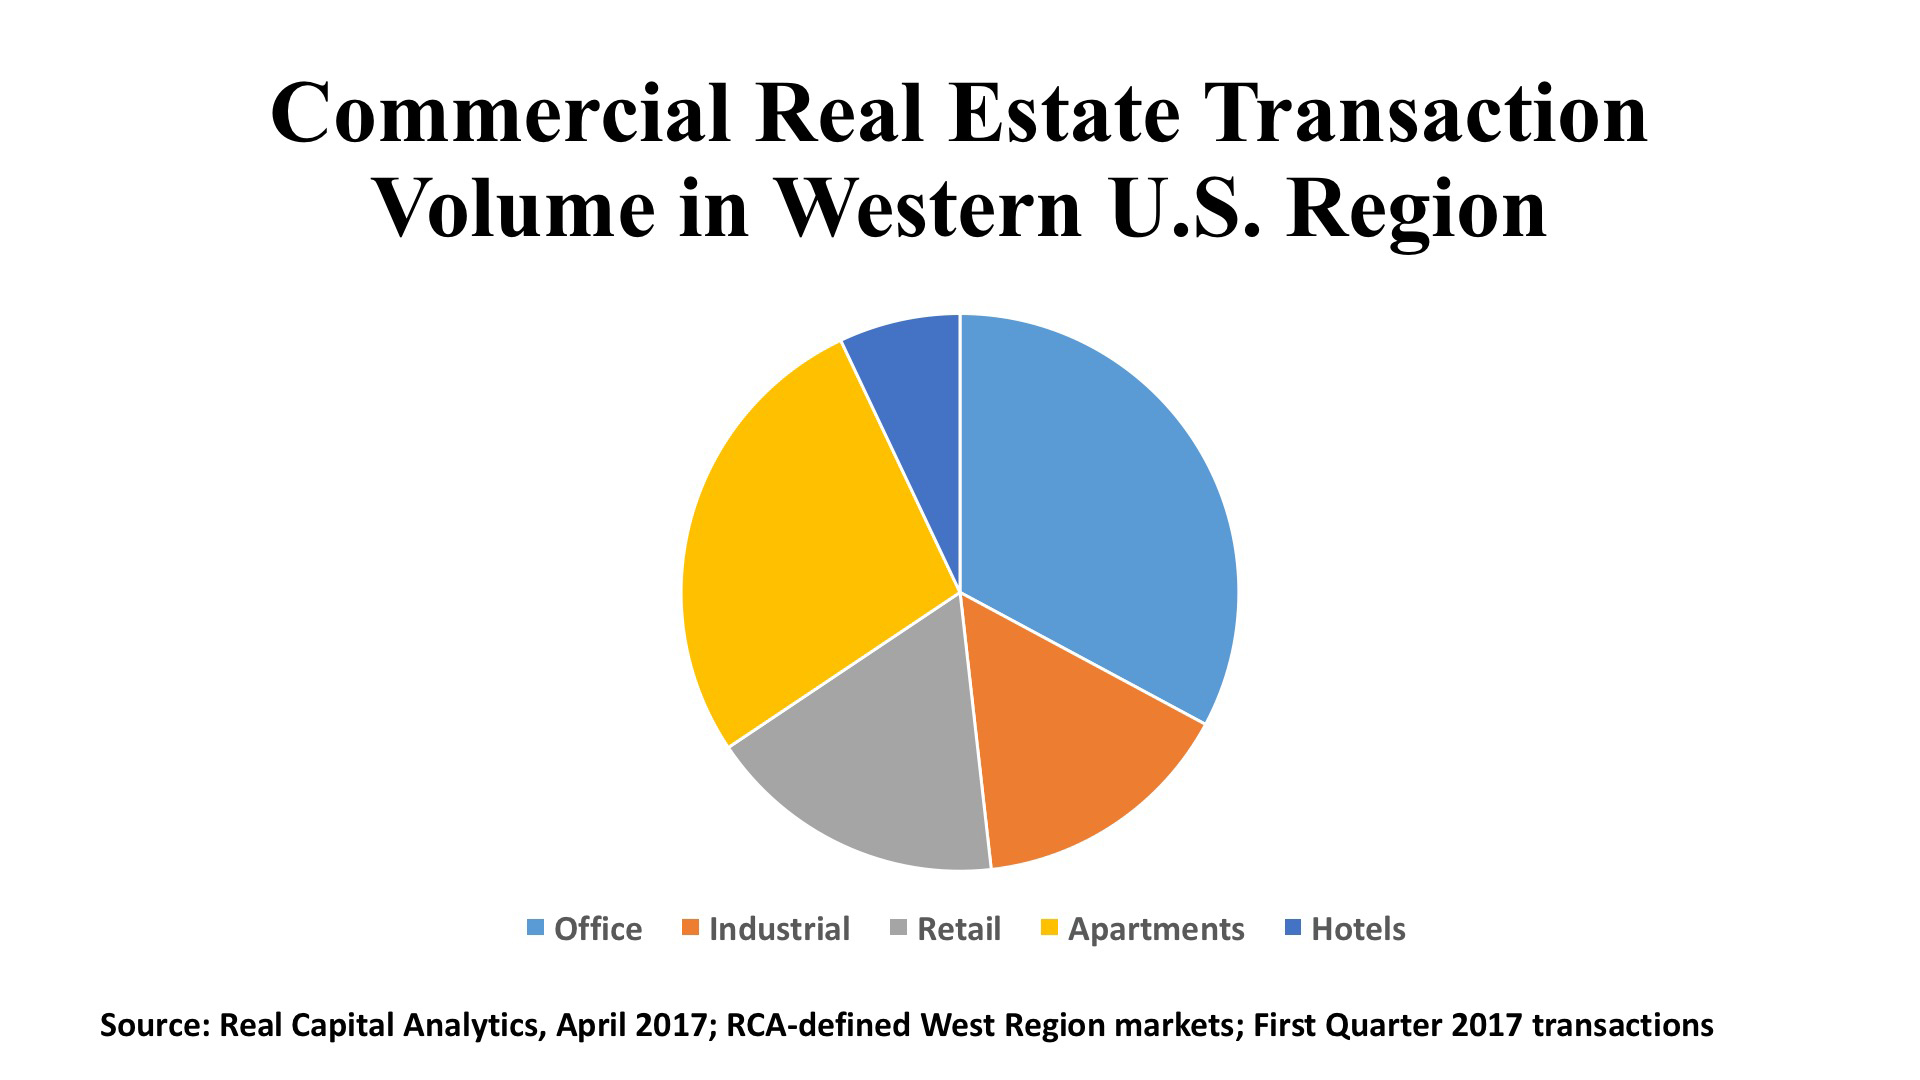
With $25.5 billion in aggregate purchases across five property types (office, industrial, retail, apartments, and hotels), the Western states accounted for a creditable 28.7% share of total US investment volume in early 2017. This ranked the region behind the East but ahead of the Central states year-to-date. For the twelve months ending March 2017, the West claimed a 30.4% share of the nation’s investment aggregate. So there has been modest recent slippage vis-à-vis the US benchmark. As illustrated in the accompanying pie chart, offices edged out apartments in First Quarter 2017 activity, followed by retail properties, industrials, and lastly hotels.
Office. Like most of the rest of the country, the West is seeing office transaction volume retreating from the cyclical highs of 2015 and early 2016, but nevertheless marking activity that is fairly robust against long-term historical norms. Some 397 office transactions were recorded by Real Capital Analytics during the First Quarter, amounting to $8.4 billion in deals. Los Angeles and San Francisco were, far and away, the most powerful capital magnets, with $3.6 billion and $2.3 billion in office volume, respectively. San Jose just missed hitting the billion dollar mark, with 23 properties attracting $999 million in sales. But Seattle, Phoenix, San Diego, and Orange County can’t be ignored as each had a half-billion or more in office deals during the first three months of this year. Private domestic investors (44%) and institutions (28%) registered the highest buyer shares, but international investors from Canada, Germany, and China also made notable office acquisitions.
Industrial. This sector saw the most significant pullback in investor volume of the commercial property types in early 2017, dropping nearly 40% from the prior period to $3.9 billion aggregate sales price. More worrisome is the trend: year-over-year volume has dropped regionally in four of the past five quarters, and the 12-month rolling average transaction volume has dropped 22% since its peak in late 2015. So recent weakness is not a one-off phenomenon. Remarkably, though, prices have stayed rather firm with the average cap rate in the West at 5.9%, a full 100 basis points lower than the US mean cap rate during early 2017. L.A. enjoyed more than $1 billion in industrial sales activity for the quarter, followed by San Jose with $723 million, and Orange County’s $515 million. More than half the buyers were domestic private investors (52%), with domestic institutions a distant second with 21%.
Retail. Given the personal income and job growth data presented above, it should not be surprising to see investors selecting markets like Los Angeles and San Francisco disproportionately for shopping property purchases. Each of these markets had more than $1 billion in First Quarter retail property investment, as these two powerhouse cities accounted for 48% of the region’s capital volume in the sector. Retail assets are holding value nicely, with a median cap rate of 5.7%, compared with 6.5% for the US as a whole. REITs represented a significant 31% of the recent retail investment in the West, but this still lagged the private domestic investors’ 51% share in early 2017. Institutional and cross-border investors, in contrast, have been relatively quiet in early 2017.
About TCN Worldwide
TCN Worldwide, a consortium of leading independent commercial real estate firms, provides complete integrated real estate solutions locally and internationally. With commercial real estate professionals serving more than 200 primary and secondary markets worldwide and representing over 80 million square feet of space under management, TCN Worldwide is one of the most comprehensive service providers in the industry. An extensive range of real estate services coupled with a personal commitment to exceed client expectations is what allows TCN Worldwide to be a leader in the commercial real estate industry.
TCN Worldwide ranks as one of the largest service providers in the industry, consisting of more than 5,500 commercial real estate professionals in 170 offices across 25 countries, and collectively representing more than $58.6 billion in annual transaction volume.