National and Macroeconomic Overview
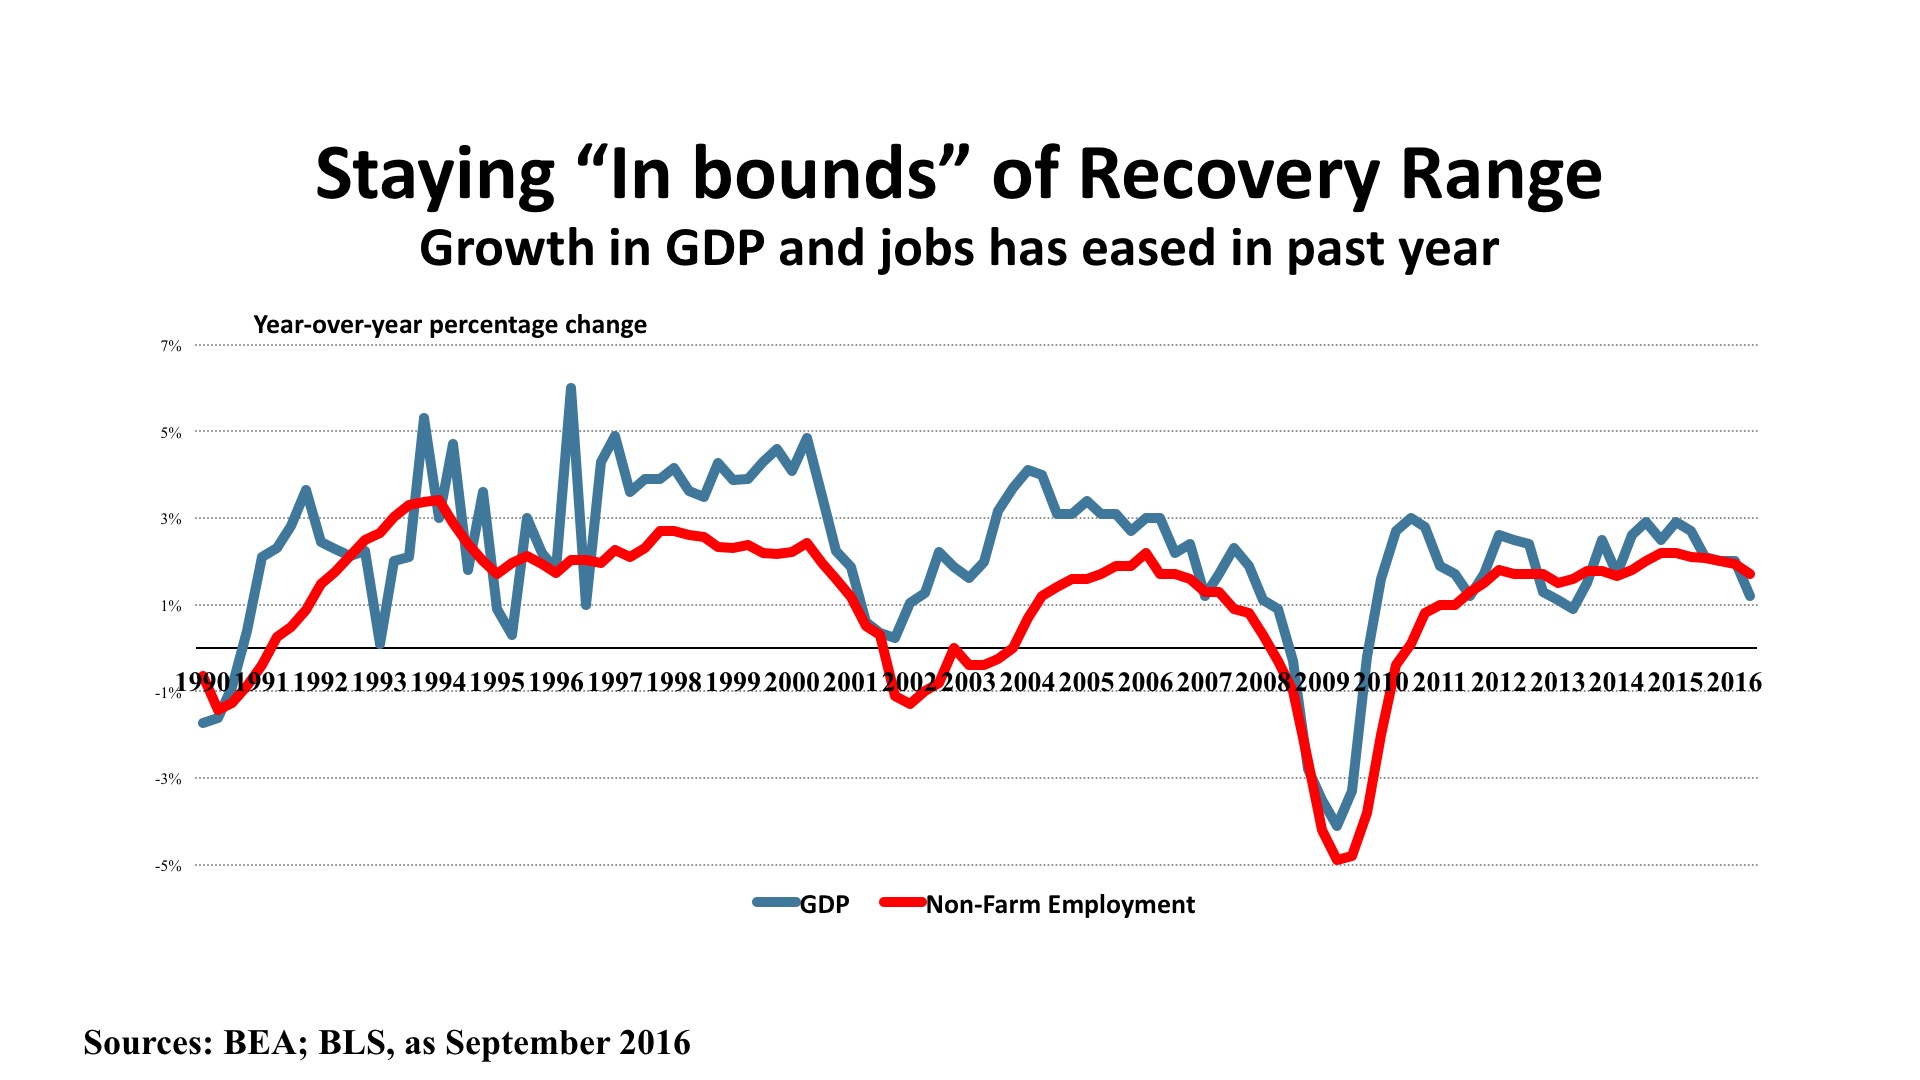
The Bureau of Economic Analysis “final” GDP estimate for the Second Quarter was released on September 29th, and showed overall economic growth at a 1.4 percent annual rate. This was the third consecutive sub-par quarter, and confirmed that the long expansion (now at 86 months in duration) is slowing its momentum. While the initial Third Quarter estimate will not be out until early November, preliminary data indicate continued sluggishness. Retail sales are up just 1.9 percent year over year. Housing starts, permits, and home prices slipped during the summer. Industrial production and capacity utilization are also in decline from 2015.
More positively, net real exports have risen for the last several months, and this should be strengthening GDP during the second half. The auto industry has also been trending upward. Incomes have started to rise, and for the first time in this cycle lower and middle-income households are benefiting materially, according to a Census Bureau study released in September. This is contributing to a small uptick in inflation, with core CPI now up 2.3 percent year over year.
Jobs. Employment growth has decelerated in 2016, averaging just 178,000 monthly through September. That’s a 1.7 percent annual growth rate, down from the 2.1 percent rate in 2015, but still enough to add 2,447,000 jobs to the economy for the 12 months ending September 2016. Business and professional services, healthcare, retail trade, and food services led the growth, indicating that job growth is positively spread across a variety of worker skill levels. The BLS “JOLTS” report (Job Openings and Labor Turnover Survey) shows twice as many workers quitting jobs compared with layoffs, indicating improving worker confidence. About 5.4 million job openings were reported in August (the most recent data published), and there were 5.2 million hirings that month. The unemployment rate stood at 5.0 percent, and has been relatively stable during the past year.
Policy. The Federal Reserve once again decline to push interest rates up at the September meeting of the Open Market Committee. Acknowledging the mixed economic signals, the Fed affirmed its accommodative monetary policy, awaiting evidence of stronger employment growth and a sustained inflation level close to its announced two percent target. It is worth noting that the Committee was split 7-3 on the question of raising rates. International influences remain critical in shaping policy, as the Brexit vote in the U.K. has triggered a steep decline in the Pound Sterling. U.S. fiscal policy remains in neutral, as this election year moves toward its “lame duck” period and uncertainty about the composition of political balance between the executive and legislative branches makes any near-term change unlikely in 2016.
Outlook. Improvements in household incomes, the stabilization of unemployment at a comparatively low rate, and an uptick in consumer confidence to its highest level since the Great Recession is prompting expectations of 2.5 percent GDP growth in the second half of 2016, followed by 2.2 percent growth during 2017. Personal consumption expenditures should help drive improved retail performance, and the jobless rate is projected to drop to the 4.6 – 4.9 percent range in 2017. This combination, in turn, should permit the Fed to nudge interest rates upward – although this has long been forecast and has yet to been seen in any meaningful sense.
Regional Conditions in the Eastern States
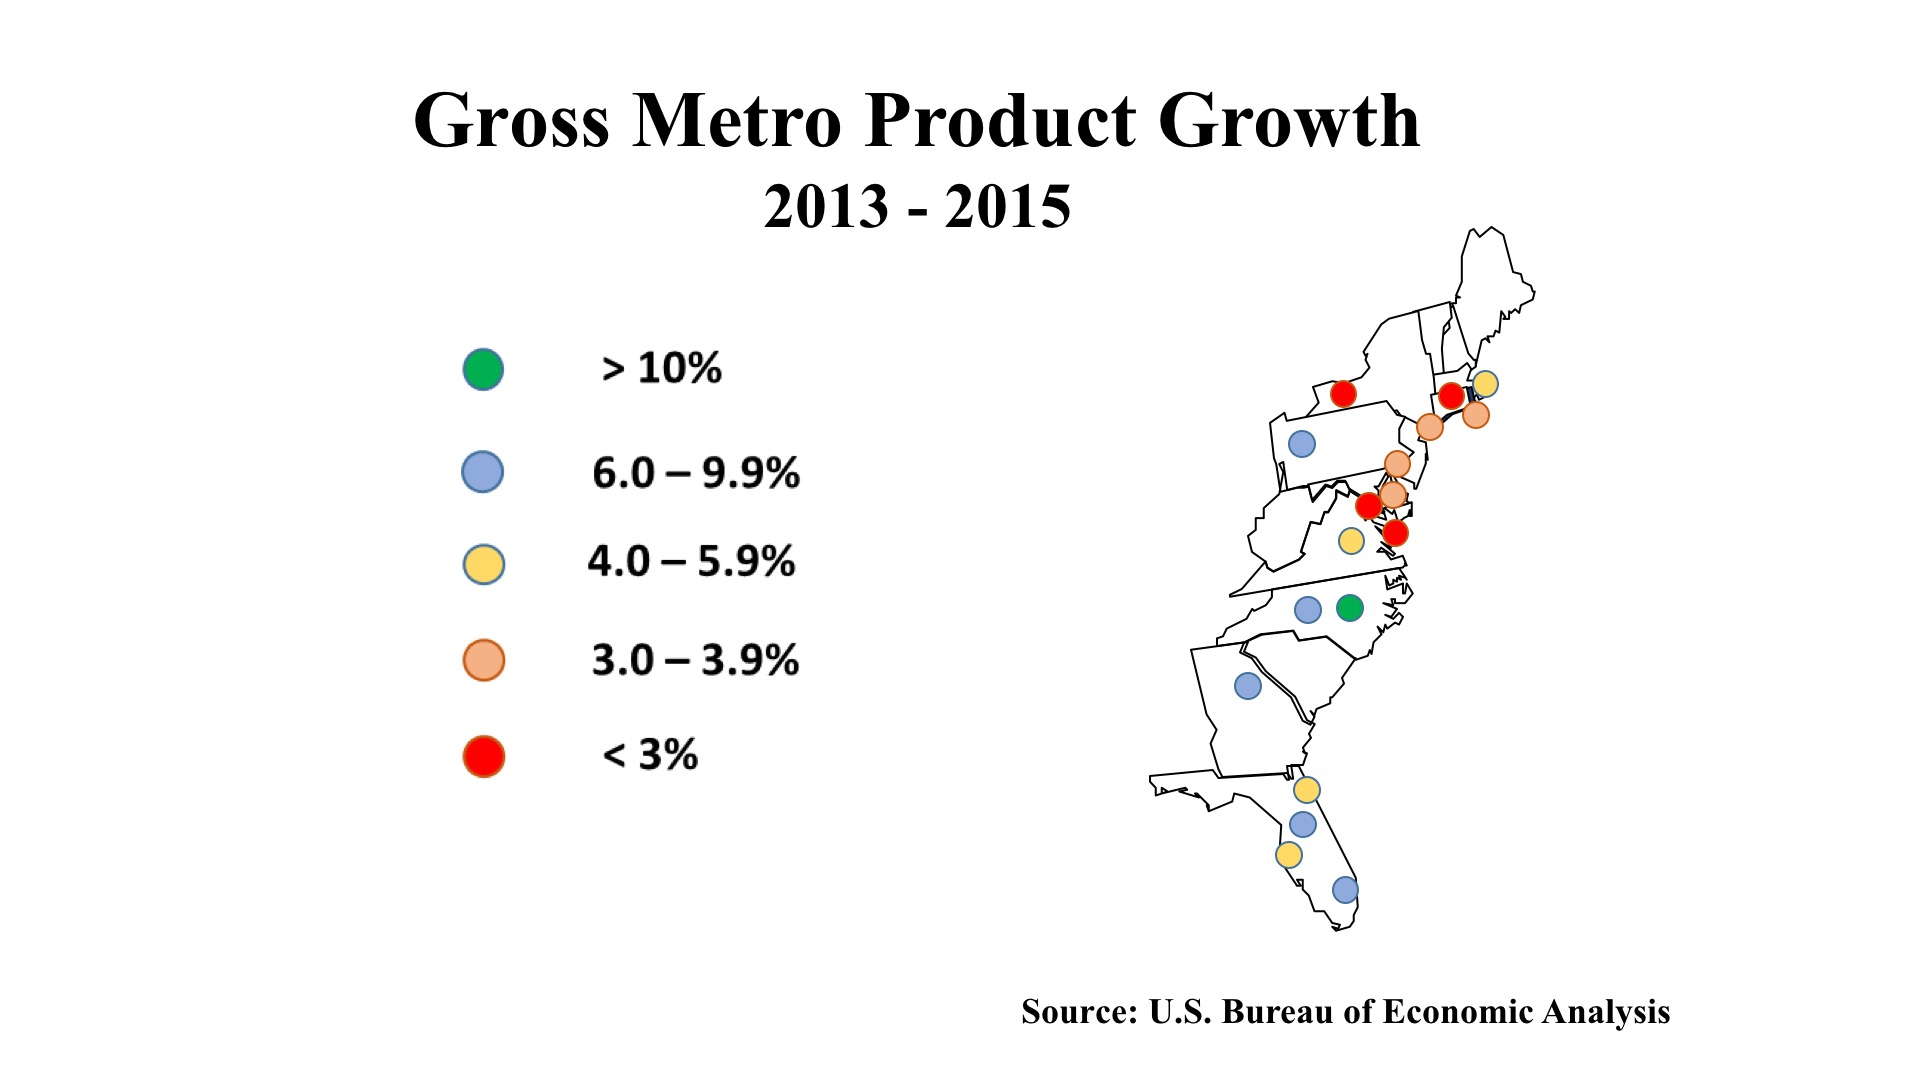
Over the past several years, economic vigor on the Atlantic Seaboard has strengthened as we move from north to south. Gross Metro Product (GMP) is the local equivalent of GDP, and the accompanying map shows the percentage change in GMP for 18 East Coast metros 2013-2015. Raleigh is one of only four metros in the U.S. that posted a double-digit gain over the period. But four other Southeast metros – Miami, Orlando, Atlanta, and Charlotte – enjoyed growth of six percent or more. North of the Mason-Dixon line (the border between Pennsylvania and Maryland) only Pittsburgh had similarly strong expansion.
Statewide employment figures, through August 2016, confirm the GMP story. Florida posted a 12-month job gain of 259,800 (3.2%) and Georgia added 104,000 workers (2.4%). New York also had a six-digit job increase (102,500), but this was just a 1.1% advance for its much larger employment base. Massachusetts and Maryland, with employment growth of 1.9% and 1.8% respectively, grew slightly faster than the U.S. average over the period. This is not to say all is troublesome in the Northeast. Unemployment is generally low: 3.0% in New Hampshire, 3.3% in Vermont, and 4.0% in Maine.
The more interesting story, though, may be the skills squeeze being experience in many of the eastern states. This is affecting both blue-collar and white collar jobs. The service-dominant Boston-Washington corridor has intense competition for IT professionals, engineers, and medical professionals. But up and down I-95, from Maine to Florida, there are reports of employers searching for experienced welders, truck drivers, construction workers, and mechanics. The hunt for good workers is so intense that there are reports of “poaching” by firms overtly recruiting directly from competitors.
One sector that does appear to be softening significantly is tourism. The strengthening of the dollar simultaneously encourages Americans to travel abroad, while making it more costly for international visitors to vacation in the U.S. Layered over this, especially in Florida, is concern about the mosquito-borne Zika virus. With human-to-human transmission now confirmed, cities further north are already taking public health measure to combat further spread.
The East Coast economy still enjoys ample capital and credit for business. While Dodd-Frank and Basel III banking regulation has had a restraining influence, especially on development lending, non-traditional debt sources are filling the gap and there is no talk of a credit crunch either currently or on the horizon. After a series of “bubbles” in the economy, a period of disciplined, moderate growth may be a healthy state of affairs all around.
Commercial Property Investment Trends
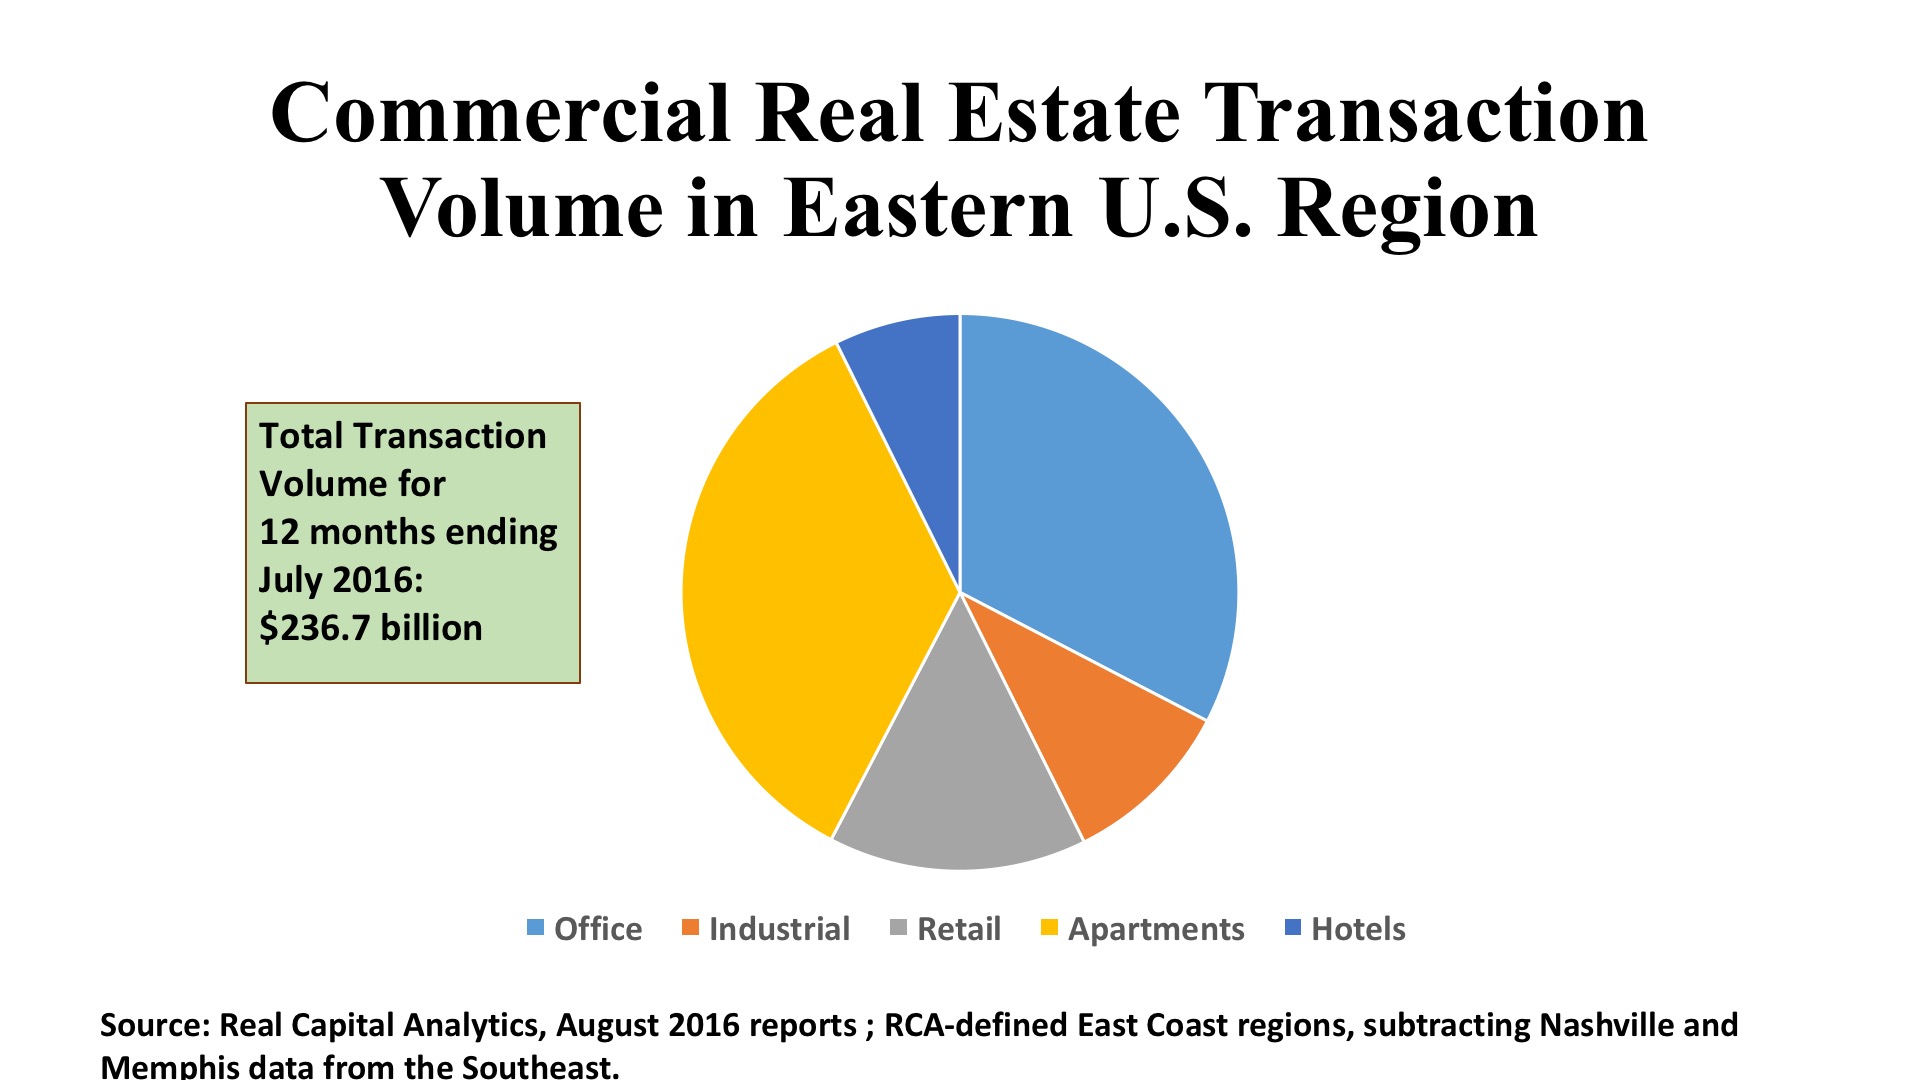
Office. The Eastern region, led by New York City Boston, Atlanta, Miami, and the Washington DC metro (especially the Northern Virginia suburbs), has posted by far the highest volume of office investment in the past year. Total dollar volume for the East’s office sector was $73.9 billion, 53 percent of the U.S. total. The regional deal count was a robust, 2,161, the highest of all sections of the country and 40 percent of the U.S. total. Cap rates averaged a stunning 4.4 percent in Manhattan, 4.7 percent in downtown Boston, 5.2 percent in Washington DC, and 5.2 percent in the Miami CBD. The norm for downtown offices was 5.7 percent across the U.S. Philadelphia’s suburbs saw strong activity, $1.6 billion, as did Northern New Jersey with $2.3 billion. Atlanta posted the greatest number of suburban office transactions, 154 deals with an aggregate price of $3.2 billion. It should be noted, however, that this region (and indeed the rest of the country) has seen a pullback in overall investment in 2016 as buyers consider properties fully priced.
Industrial. The major distribution hubs in Atlanta and Northern New Jersey led the industrial investment volume over the past twelve months, with $2.1 billion and $1.5 billion in warehouse/distribution deals respectively. Boston had the lead in Flex/R&D properties, with $1.3 billion in aggregate volume for that sector. Of the major property sectors, industrials have seen the greatest decline in total dollar volume, a 34 percent year over year drop nationally, and the East has not been immune to this trend. However, much of this region has standing industrial assets ripe for conversion, as illustrated by the 143 warehouse deals in New York’s outer boroughs, totaling $2 billion in price, at $320 per square foot. For many of these assets, use is shifting to office or residential, or is being adapted as “last mile” fulfillment for e-commerce. Also of note is the strong performance in so-called “Tertiary” markets, which attracted $2.6 billion in the Southeast and $2.2 billion in the Mid-Atlantic states.
Retail. The densely populated Atlantic Seaboard accounted for $34 billion in retail investment over the past year, which was 42 percent of the nation total for the shopping property sector. Investment was well distributed amongst the subsectors – neighborhood and community centers, urban high street assets, and major metros versus tertiary markets. Typical suburban strip centers were most actively traded in Northern New Jersey, which saw 48 deals valued at $1.2 billion. Strip centers and outlet properties were acquired by investors/operators such as Kimco, Walmart, Home Depot, and Tanger that specialize in such retail facilities, with recent deals in the suburbs of Washington, Boston, and Atlanta. As in the industrial sector, though, many retail investors are penetrating tertiary markets, especially in the Southeast, in search of higher cap rates and lower prices per square foot.