Overview of National Economic Context
The major macro-economic indicators. The First Quarter doldrums struck again in 2016. Relatively weak job gains in January (168,000 net new jobs for the month) were a drag on First Quarter totals, with the three-month employment increase at just 628,000. The pattern of the past several years has been economic acceleration in the Spring and Summer months. Year-over-year, U.S. employment gains exceeded 2.8 million, or 2.0%. Wages are starting to respond to the low five percent unemployment rate, with average hourly earnings up 2.3% for the year. These are “real” wage gains, as the CPI increase for the 12-months ending March 2016 was just 0.9%. Although recent increases in energy prices suggest some upward inflation to come, the US Energy Information Agency predicts that gasoline prices will average $2.04 per gallon nationally this summer, compared with $2.63 per gallon last year. That could buoy retail spending and vacation travel for consumers, which would be a welcome trend for the stores and hotels sector of the economy. The stock market gyrations certainly raised the level of nervousness across the economy. The VIX was high and the drop in the equities indexes during the first six weeks of the year was more than 10%. But since that "bottom", stock prices are up more than 15%. We are entering the Second Quarter with positive momentum.
The major policy indicators. The Fed looks like it has taken "defensive driving" courses to heart. As the central bank initiated the long-expected round of interest rate increases, the expectation was that we would see four 25 basis point bumps in 2016. The best estimate now is just two rounds of upward adjustments this year, and then only on the evidence of sustainable growth in jobs and output. During the presidential primary season, voter impatience with the domestic impact of globalization is making further expansion of free trade agreements increasingly unlikely. This could ripple through the US distribution system, especially around ports, signaling a slowdown in warehousing and logistics. Immigration is also a hot-button issue, and net inflows are down slightly since early in this decade – putting additional pressure on labor force growth. The mix of immigrants is also changing, with Asian inflows replacing Latin American as the largest source of new residents. The foreign-born population of the US, which numbered 45 million in 2015, is projected to reach 78 million by 2065, according to demographers at the Pew Research Center.
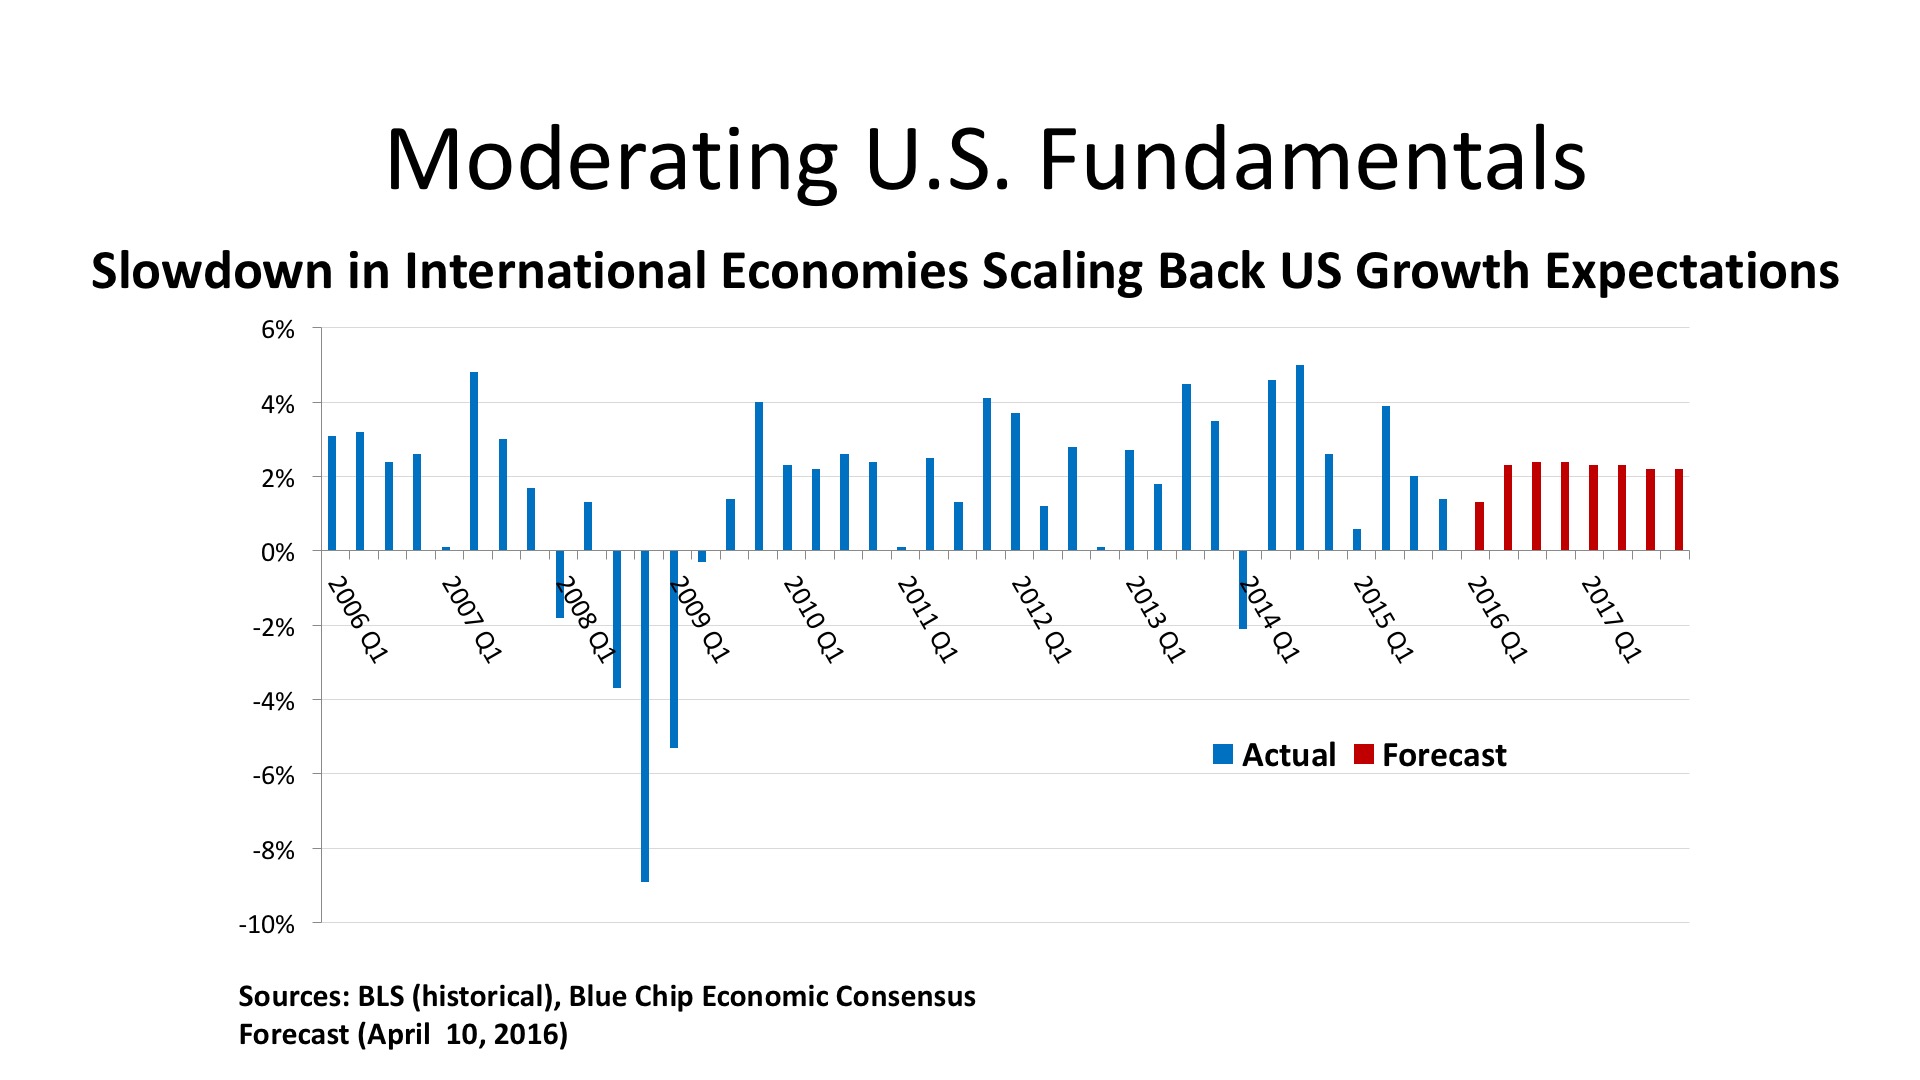
The Outlook. The Blue Chip Economists’ consensus forecast has pulled back on its growth expectations for 2016 and 2017, anticipating just a 2.0% real GDP advance this year, and 2.3% next year. Positive components going forward are moderate gains in retail spending, based upon job and wage growth, a moderate uptick in business investment as energy prices stabilize, and increases in homebuilding. Manufacturing should benefit as high levels of current inventory are reduced, but the strong US dollar is hobbling exports. Age demographics continue to constrain the labor markets, with Boomer retirements rising and Gen Y having passed its peak of labor force entry. The outlook for the unemployment rate is a reduction to the 4.5% - 4.6% range later this year and into 2017.
Regional Conditions in the Eastern States
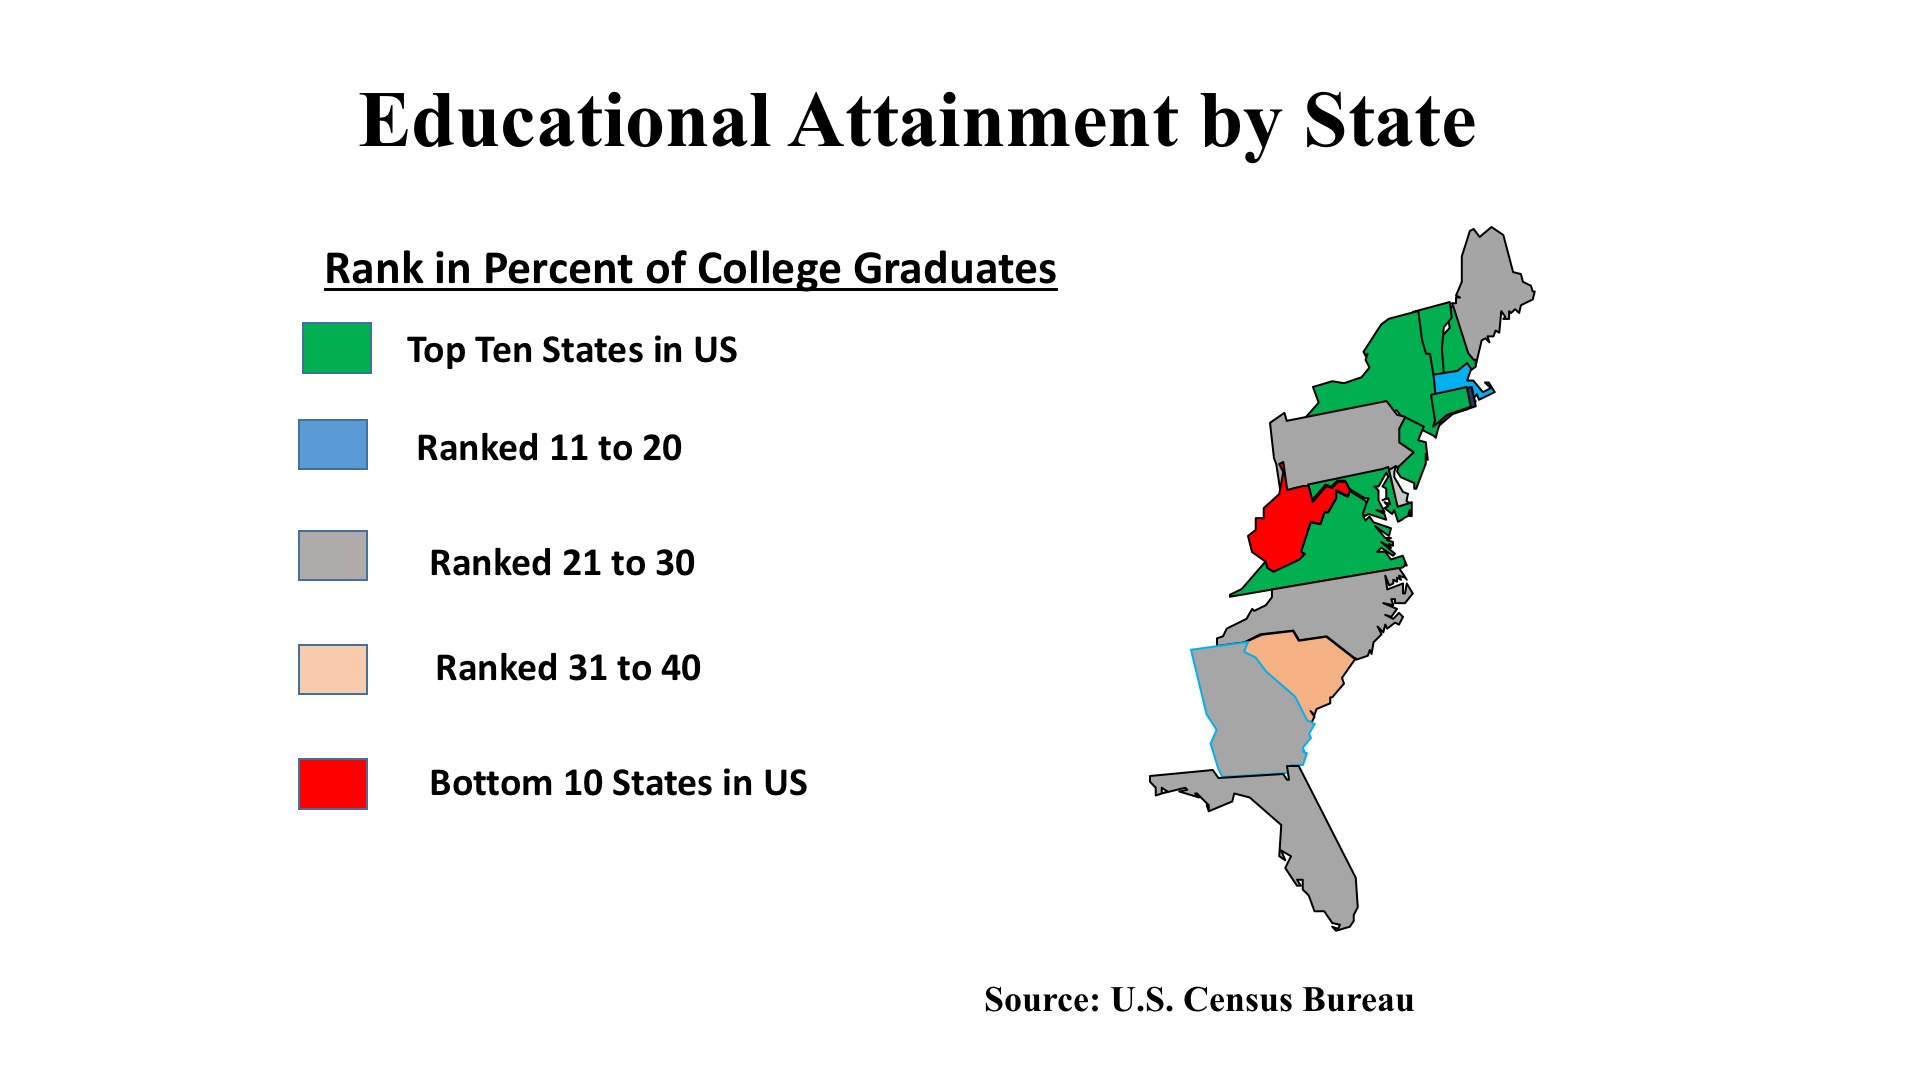
Employment Trends. Labor market surveys are revealing increased scarcity of well-qualified job-seekers across a broad range of occupations. Despite an above-average concentration of college-educated workers along the East Coast, STEM (scientific, technology, engineering, and mathematics) specialists are much in demand, and employers are in bidding wars to secure this talent. But it is not only a phenomenon restricted to elite jobs. Construction workers, and even entry-level workers in retail, hospitality, and food service industries are seeing employment opportunities increasing along the Atlantic Seaboard. Construction jobs are up 4.3% in the past year in Boston, 5.9% in New York, 5.6% in and around Washington DC, a remarkable 8.2% in the Philadelphia area, and at a double-digit (10.5%) rate in South Florida. Leisure and Hospitality employment surged 7.0% in Atlanta, and construction jobs there were up even more, at 7.4%.
Employers are reporting increased investment in training programs, both as a recruiting device and also as a means of retaining talent. While nationwide employment growth averaged 2.0%, many large East Coast market posted superior gains: led by 3.5% in Atlanta, but with strong trends in Miami (2.9%), Washington (2.3%). New York and Philadelphia also saw job gains edging above the national average, with both these large metro areas tallying gains of 2.1% in the past year. Business and professional services jobs, a mainstay of office demand, have generally been growing as fast or faster than total employment in these cities. But financial jobs are lagging somewhat in many places. Boston, Miami, and Atlanta, however, are seeing superior job growth in the banking sector.
Macro-economic conditions. The Eastern region begins Spring 2016 with many positive indicators. Housing markets, in particular, have been strengthening as a result of improving employment, a small uptick in wages, and continuing favorable credit conditions. Housing is a key economic driver, because of the many multiplier effects, including purchases of furniture and appliances (helping the retail sector), demand for legal and banking services, and even the provision of public sector services from schools, police and fire safety, and infrastructure expansion or upgrades. Residential trends are in many ways a leading indicator for commercial real estate markets.
Bankers are reporting strong business credit demand, an indication of higher levels of business capital investment for the year ahead. The past several years have seen exceptional levels of corporate profits, but a high degree of “retained earnings.” Improved levels of non-residential fixed investment foretells a rising level of productivity for East Coast businesses, as most of the output gains from squeezing more work out of existing employees have now been realized.
At the same time, there are signs that some sectors are hitting a plateau. Rail freight volumes – especially in shipments of natural resources and heavy equipment – are stagnating. Luxury goods and upper-end residential demand also appear to be hitting a market-saturation point. International tourism is slowing, due to the strong dollar, and this will affect full-service hotels if that trend persists. However, another summer of relatively cheap gas prices will be helping hotels focused on family vacation travel.
Commercial Property Investment Trends
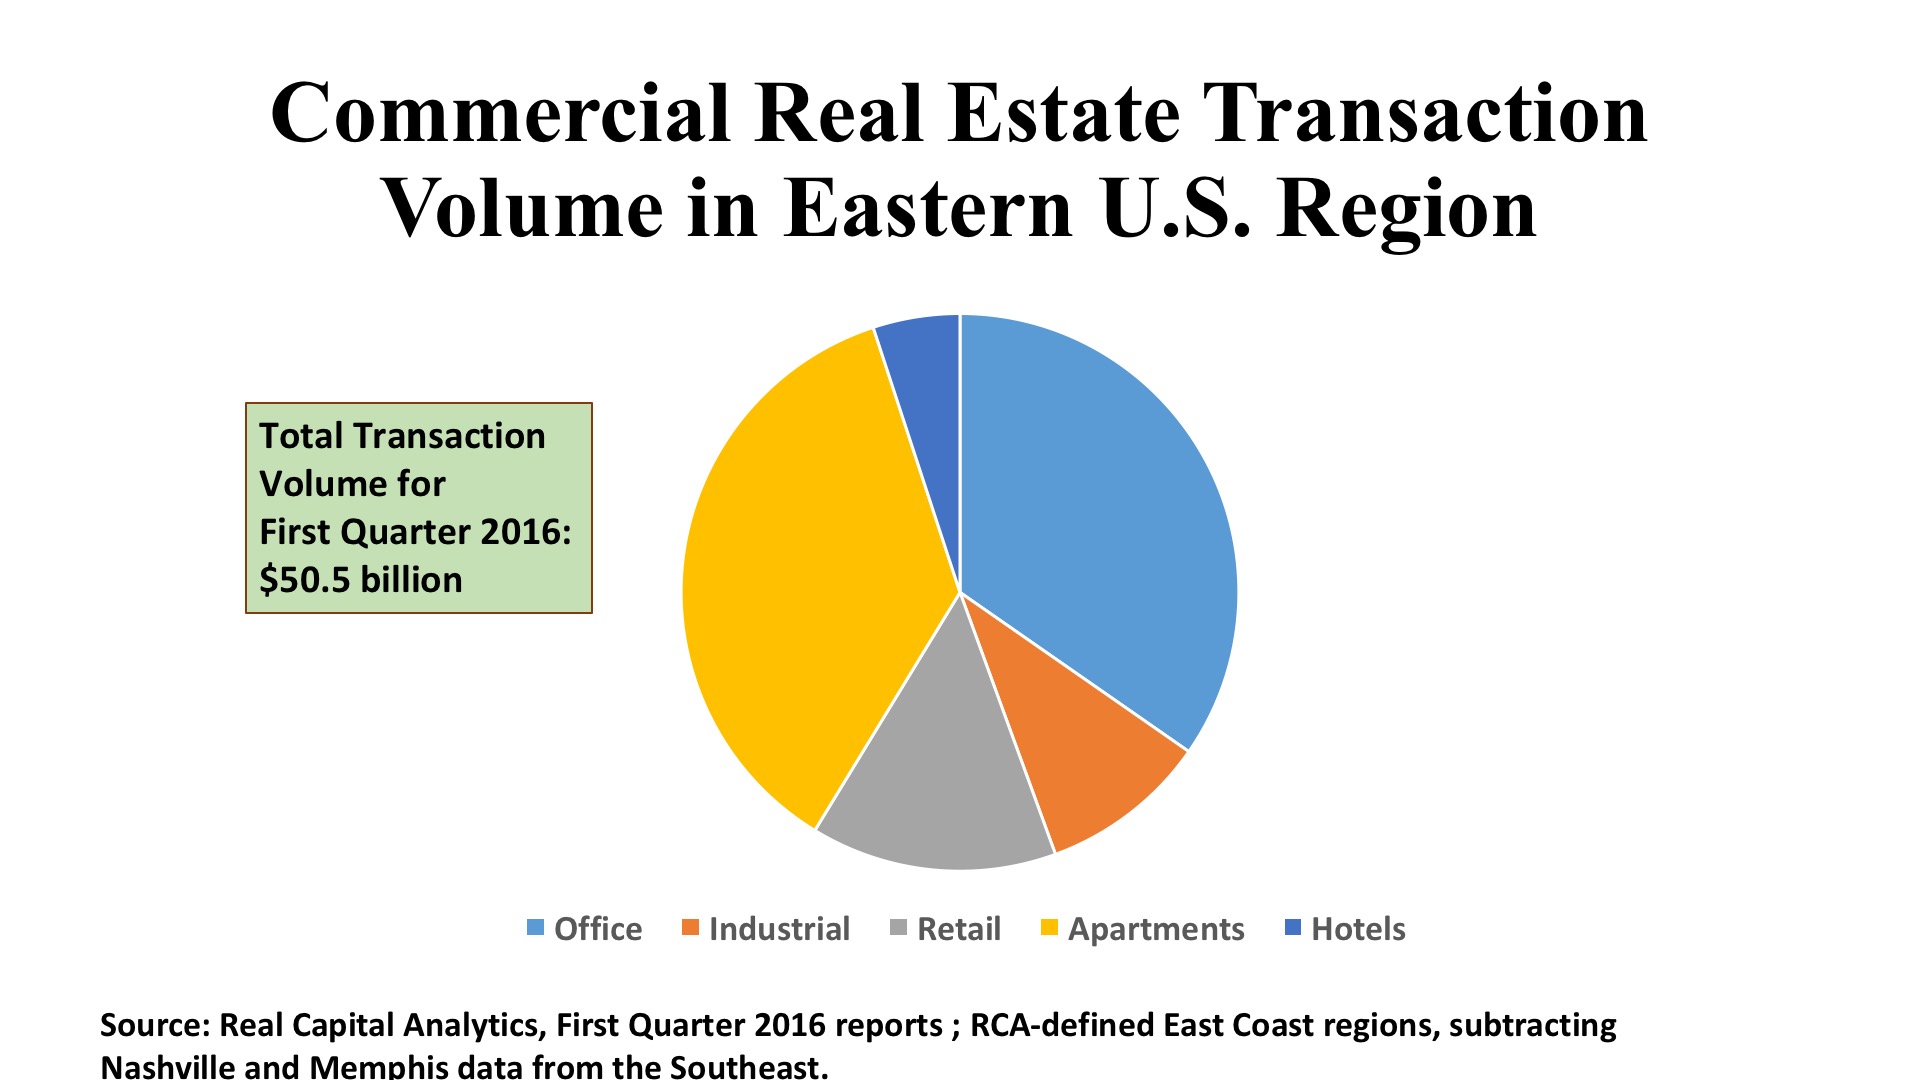
Office. There were $31.2 billion in office building acquisitions in the First Quarter of 2016, and $17.2 billion (55.2%) of this investment volume was directed to Atlantic Seaboard markets. Since the total population of the states from Maine to Florida is just 37.2%, it is evident that the East Coast is punching above its weight in attracting office investment capital. While aggregate office transaction volume was down fifteen percent (first quarter 2015 to first quarter 2016), all three major segments in the East (New England, the Mid-Atlantic, and the Southeast) were up in total dollars invested for the first three months of the year. Notable gains were recording in Boston, Philadelphia, the DC suburbs, Charlotte, Tampa, and the South Florida metros.
But it was the concentration of the quarter’s top deals that especially stands out. Sixteen of the top 25 office deals, ranked by sales price, were in the East. Unsurprisingly, Manhattan had the three top deals, among its 36 office assets reflecting $5.7 billion in investment. But Philadelphia grabbed the fifth-ranked deal, a $354 million ($410 per sq. ft) acquisition by Coretrust Capital and Korea Investment Holdings. Shorenstein Properties purchased Atlanta’s Bank of America Plaza for $220 million ($171 per sq. ft.), and Charlotte saw One Wells Fargo Center sell for $213 million ($288 per sq. ft.) Add Brooklyn, NY to the mix, too, with Tishman Speyer buying the office portion of the 422 Fulton Street project for $170 million ($450 per sq. ft.).
Industrial. One of the megatrends of the past generation has been the “deindustrialization of America,” a theme that is being amplified politically these days by the push-back against international trade agreements. As is often the case, the tangible evidence of change can be seen in the real estate markets. On balance, the retreat of investment volume in the First Quarter 2016 is enormous – a 38% decline in aggregate sales price on a national basis. Regions along the East Coast fell pretty much in line with the US figures. With the Mid-Atlantic states down 33% and the Southeast down 45%. Real Capital Analytics (RCA) does remark, however, that pricing has been very steady with cap rates largely unchanged from a year ago.
How are the First Quarter industrial deals reflective of America’s economic changes? A look at the top deals from January-March 2016 gives us a hint. Five of the top 20 deals were in New York City’s “outer boroughs” of Brooklyn and Queens, and involved large multilevel industrial buildings slated for redevelopment, most frequently to residential use in gentrifying neighborhoods. The prices per square foot ranged between $170 and $892 – clearly unrelated to the buildings’ original functions. More traditional warehouse uses in Georgia, for instance, were also in the top deals recorded by RCA, but at prices in the $60 - $70 per square foot range. RCA also notes that the overall decline in transaction volume is almost all in the category of portfolio transactions, with single-asset industrial sales dropping only 7 percent year-over-year.
Retail. Like Industrials, transaction volume was down sharply (31%) for retail property assets in the First Quarter 2016 compared with a year ago. And for similar reasons: a pullback in portfolio and entity level deals which swelled the acquisition totals a year ago. Yet, there are distinctive features to the stores sector investment profile well worth considering. One is the focus of sophisticated institutional investors and shopping center operators in the largest deals in the Atlantic Seaboard markets. Major acquisitions were accomplished by Invesco and by New York Life in New York, by Simon Property Group and Clarion Partners in New Jersey, and DRA Advisors and Heitman in the Carolinas. This is a resounding vote of confidence in the rebound of the consumer economy in the years ahead.
Another trend worth noting is the growth of single-asset retail purchases in the secondary and tertiary markets, a likely reflection of the gathering strength of the housing recovery. Retailers may again be looking to a “rooftops strategy,” especially in metropolitan areas where suburban residential is making a come-back. At the same time, there does not seem to be much of a speculative appetite amongst the buyers: core/stabilized assets are preferred over value-add acquisitions by a margin of more than three-to-one. And, far and away, the retail segment most in demand is the neighborhood/community center, the bulwark of the shopping center industry over its long history.