National and Macroeconomic Overview
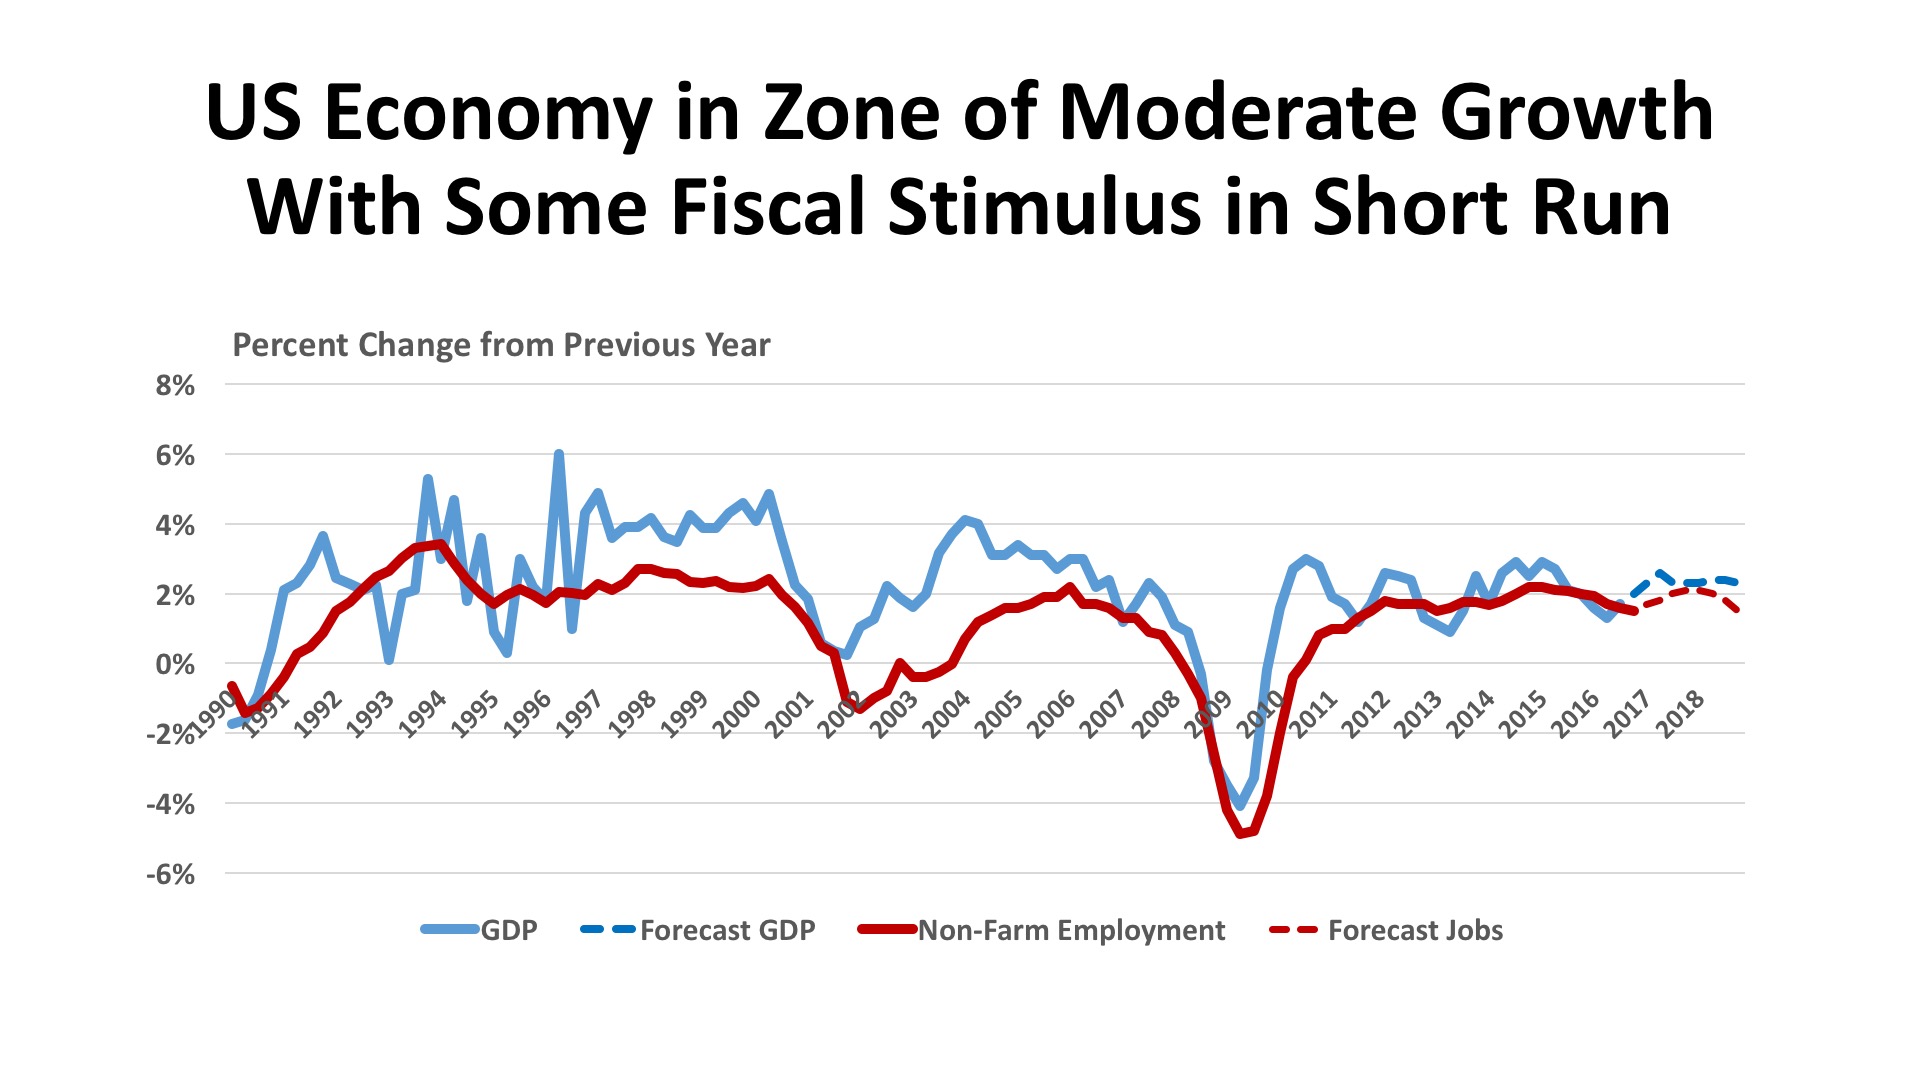
As expected, the U.S. economy accelerated in the second half of 2016 after a sluggish start that has unfortunately become a pattern this decade. The U.S. Bureau of Economic Analysis has pegged Third Quarter growth (the most recent available estimate) at a strong 3.5%, the best real performance since 3Q2014. Per capita disposable income was up 2.9% in nominal terms, and 1.9% after adjusting for inflation, a notable advance after more than a decade of sluggish gains in this measure. Corporate profits rose in the Third Quarter as well, up $50.1 billion for financial firms and $56.1 billion for non-financial companies, an improvement over earlier 2016 results in both cases. The January 2017 Federal Reserve “Beige Book” national summary indicates that economic expansion continued at a moderate pace through year-end 2016, with tight labor markets and some upward inflationary pressure. Firms and industries were said to be optimistic about growth in 2017.
Jobs. With the official unemployment rate measured at 4.7%, the economy might appear to be at full employment. But most economists understand that some slack still exists in the labor markets, with 5.6 million people employed part-time who would prefer full-time jobs and an additional 1.7 million “marginally attached” to the labor force. The labor force participation rate, which has been trending downward since the mid-1990s, now stands at 62.5%. Nevertheless, there are important signs of strengthening, not the least of which is recent wage growth. The BLS “JOLTS” report (Job Openings and Labor Turnover Survey) showed 5.5 million job opening at the end of November, with hiring (5.2 million) exceeding separations (5.0 million) that month. The “quits rate” – people leaving jobs with optimism of finding a better position – accounted for 62% of the separations. The pace of job additions slowed late in 2016, another sign that the pool of available and appropriately skilled workers is becoming somewhat shallow.
Policy. The outcome of the Presidential election signaled a potentially sharp alteration in public policy. The stock market since Election Day has signaled a belief that fiscal policy under President Trump will be stimulative in the short run, with a combination of lower taxation, lesser regulation, and Federal spending on both defense and infrastructure. The bond markets, on the other hand, are pricing an increased risk of inflation and a greater likelihood of interest rate increases during 2017. The Federal Reserve made an upward rate adjustment in December 2016, and as many as three additional moves may lie ahead in the coming year.
Outlook. Few observers are willing to hazard a detailed guess, even about near-term changes, as the incoming administration has been exceptionally vague on economic specifics and there are clear differences between 2016 campaign promises and the expressed viewpoints of cabinet nominees on key issues, including trade, healthcare, and budget balancing. The consensus of Blue Chip Economists holds its forecast as “much of the same” in 2017 and 2018, moderate growth in the range of 2.3% - 2.4% over those years.
Regional Conditions in the Central States
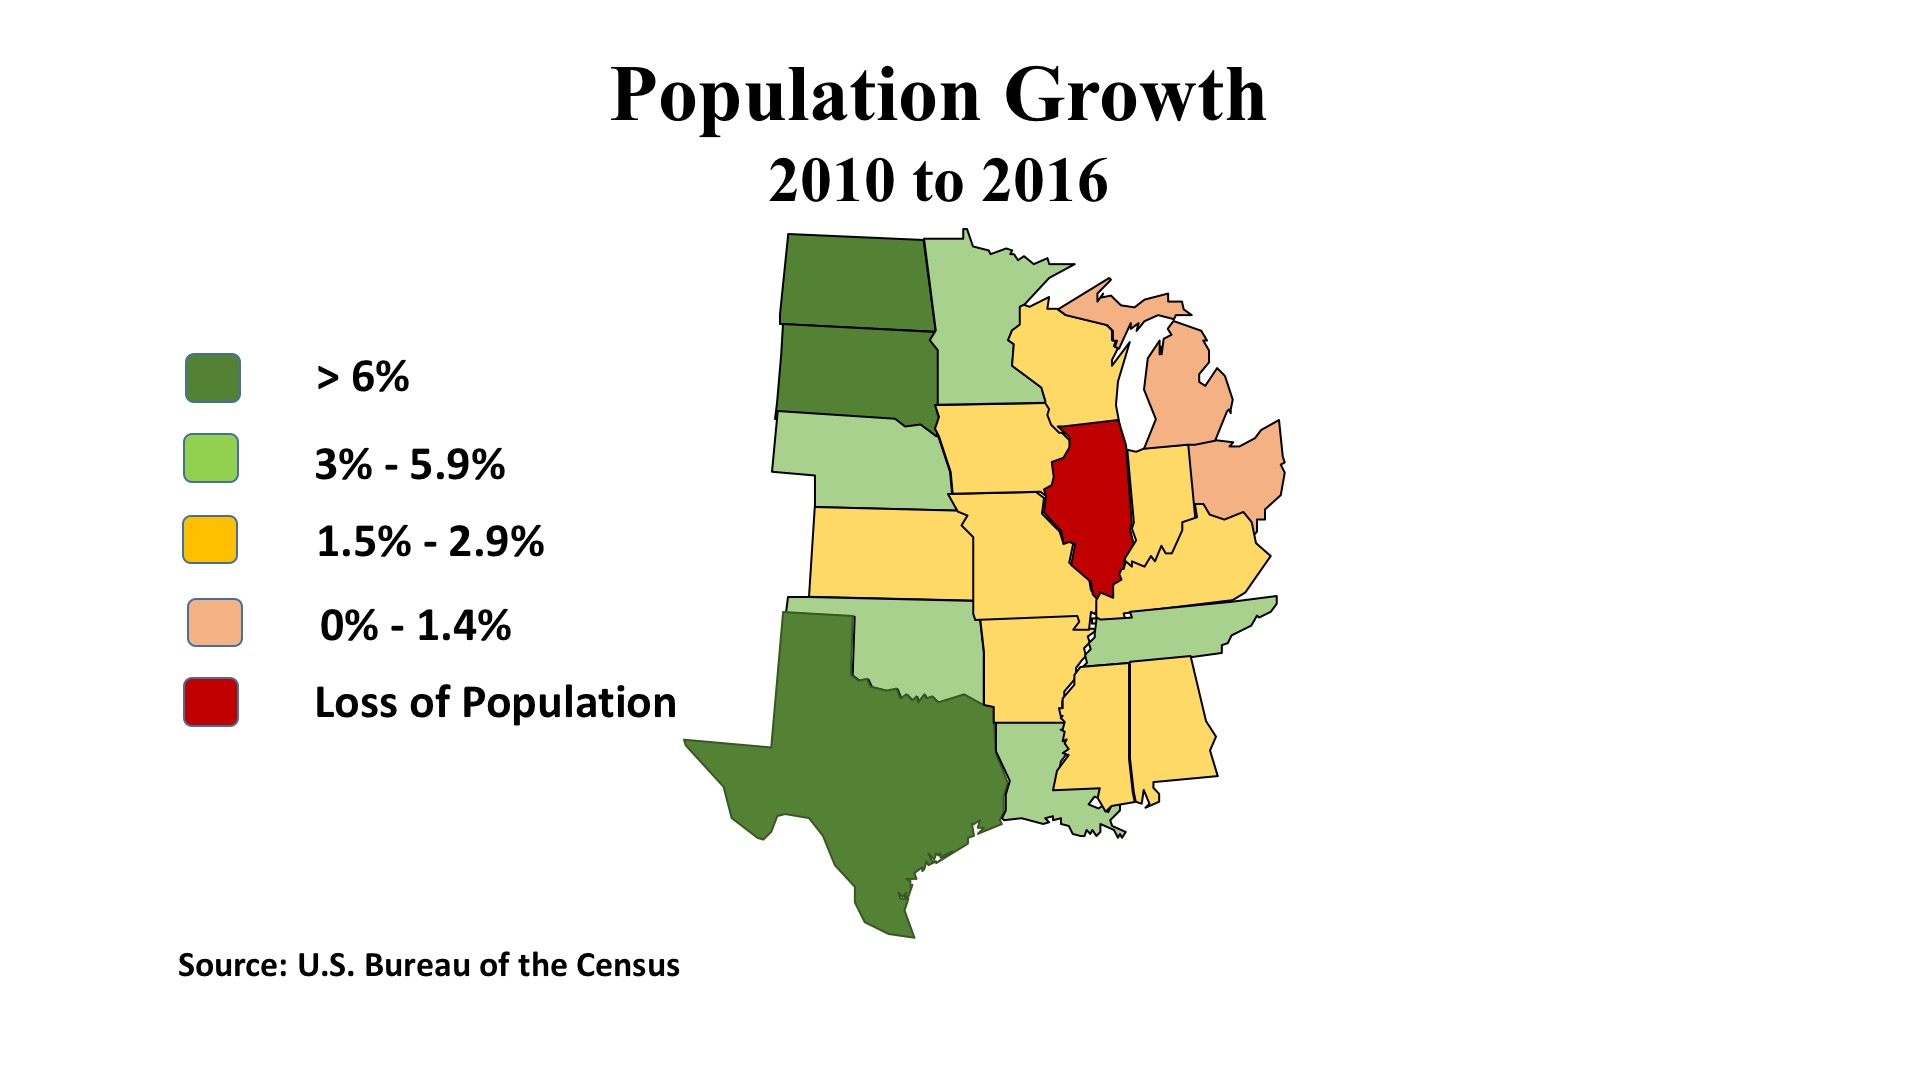
It is an aphorism that “real estate is a people business.” This refers not only to the nature of transactions, but also that property gains its value via its ability to serve the demand of the population for appropriate places to live, to work, to shop, and to recreate. Demography is fundamental to the real estate industry. The map of population growth (2010 – 2016) nicely illustrates how, in the early years of the current decade, the energy boom fueled migration into states like Texas, Oklahoma, Louisiana and the Dakotas that had deposits of petroleum and natural gas in abundance. But large swaths of the Central states – coded in yellow, pink, and red on the map, from the Canadian border to the Deep South – saw demographic growth slower than the U.S. average of 4.7% for the 2010 – 2016 period. With most of its land area rural and sparsely populated and urban areas reinventing themselves to spur economic growth, real estate demand is searching for those points of focus that will bolster income and value growth in the latter years of this decade.
Cities that have been outperforming the nation in job gains during the past year fall into a few categories. Dallas-Ft. Worth has by far the best recent record, with a twelve-month gain of 114,800 jobs and a growth rate of 3.3% (twice the national average). D-FW is notable for its well-rounded expansion. Growth by industry in the past year has been best in trade and transportation (34,000 jobs, 4.3%), although financial services grew faster, 4.8% while adding 13,600 jobs. Professional and business services saw robust growth at 4.4%, or 25,000 jobs. So economic diversity proved a boon to Big D. Nashville is another well-diversified metro area whose job growth is strong and solid, with 23,500 new jobs last year equating to a 2.5% growth rate.
Metro areas anchored by large universities and/or state governments also enjoy good growth in 2016. Ann Arbor, MI falls in this category (12,400 new jobs, a stunning 5.6% gain), as does Columbus, OH (19,200 jobs; 1.8%). Then there are some turnaround stories. Detroit’s rebound produced 34,400 new jobs (1.8%), with financial services and business services gains relating to the ongoing resurgence of its downtown. St. Louis, long lagging in the urban revival narrative, added 41,500 jobs in 2016 (3.1%), driving its unemployment rate down to 3.8%. Surprisingly, a 13,100 gain in leisure and hospitality jobs (9.0%) led the parade, but virtually all service sector industries grew at a clip exceeding 3.0%.
What lies ahead? It may take some time to discern how national policy changes impact this region. Hopes have been raised that the new administration in Washington will bolster the regionally important manufacturing sector. Trade and immigration issues, however, may raise risks for agriculture, one on America’s few net-export industries. Defense spending should boost the Gulf Coast economies around shipbuilding centers. And energy will be a wild card, largely driven by oil prices which are still forecast to remain in the $50 - $55 per barrel range with at-the-pump gas prices about the same in 2018 as they were in 2015, according to the U.S. Energy Information Agency.
Commercial Property Investment Trends
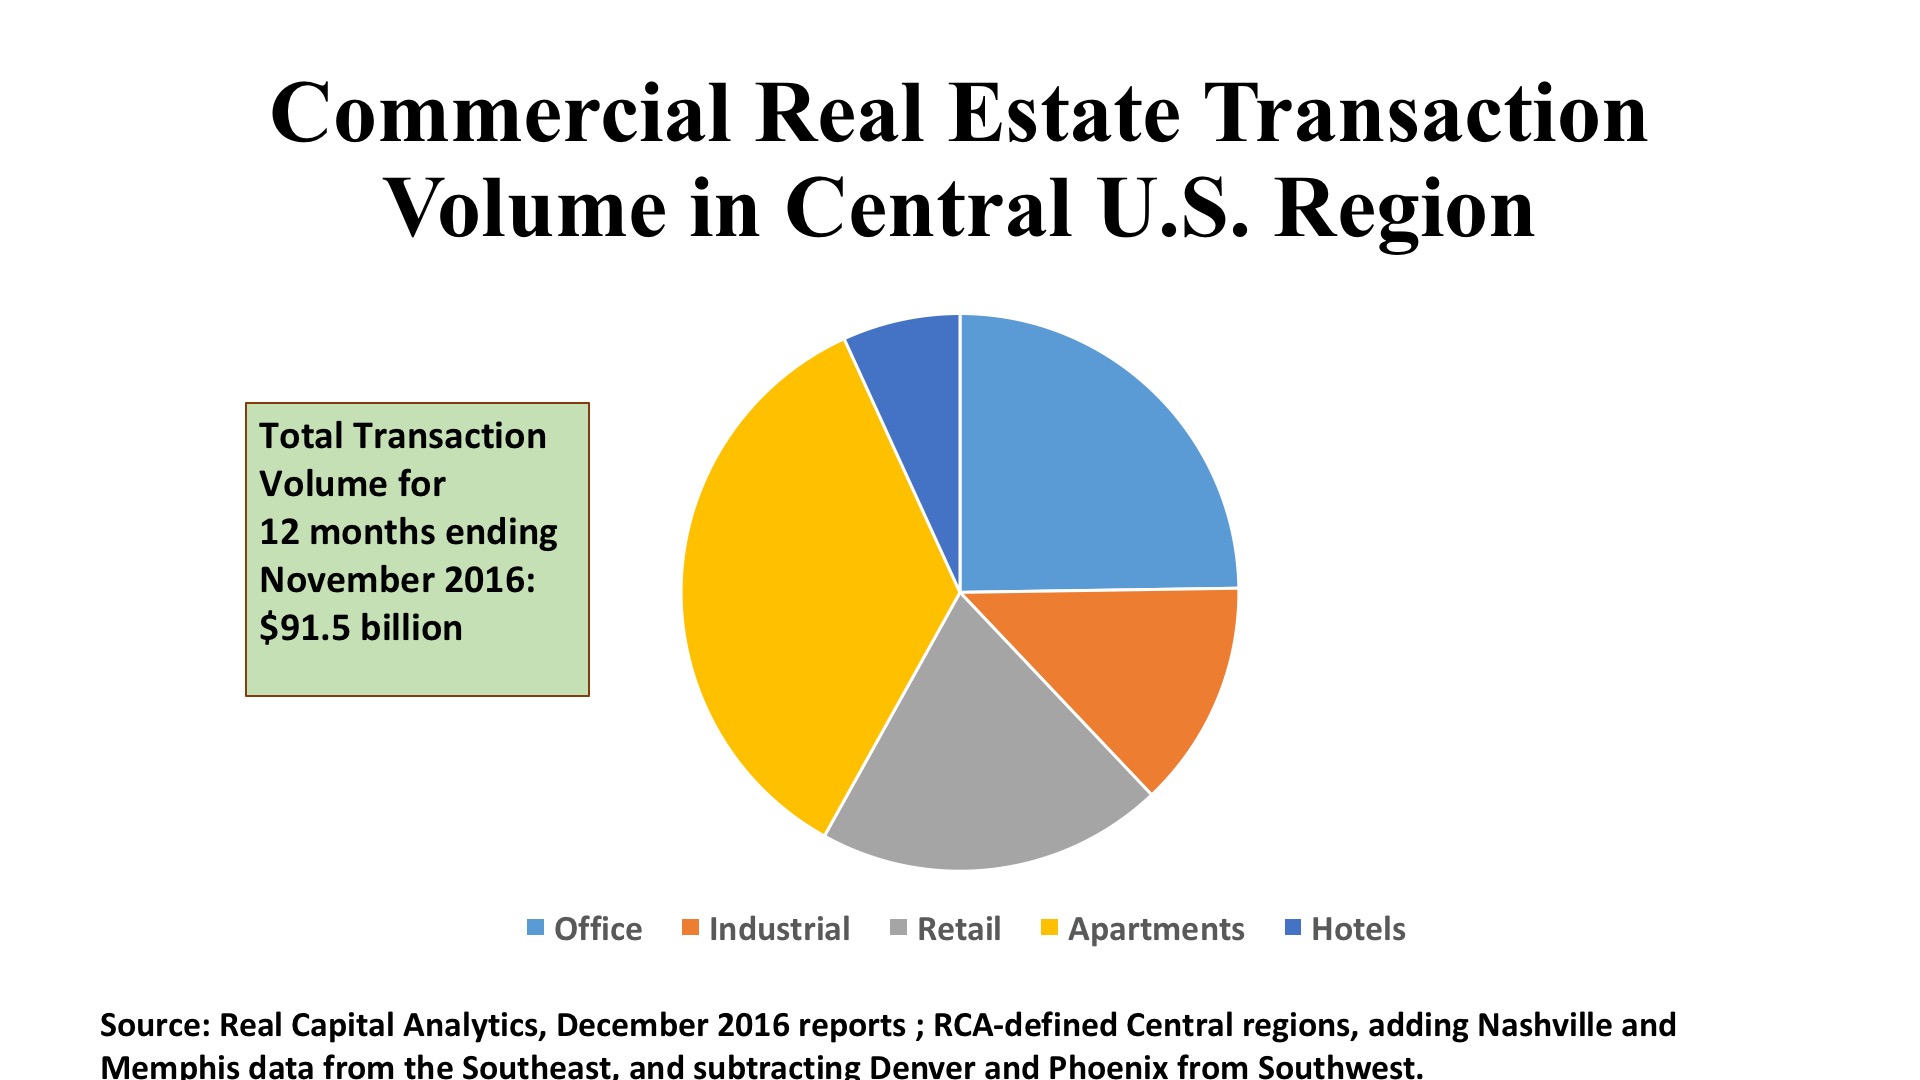
Transaction volume across the country pulled back approximately 15% in 2016, compared with the prior year. This was not necessarily a bad thing, as investment totals were approaching the pre-financial-crisis “bubble level” and there were legitimate concerns of unreasonable asset price inflations. This was especially true in the nation’s major gateway cities. While there are variations by region and by property type, the discussion which follows should be understood in the context of a market pulling back from an exuberant peak in 2015. For the Central States, the drop in property investment was 18.8%, slightly steeper than the nation as a whole.
Offices. The boom in the Energy industry had a huge impact on offices while it lasted, but the pangs of withdrawal are painful. Regional office investment volume was down 20.6% to $22.7 billion in 2016, with the Houston CBD attracting no better than $84.2 million in eight office transactions over the past 12 months. Dallas, on the other hand, garnered $5.3 billion in office deals – mostly in its far-flung suburbs. Chicago also surpassed the $5 billion threshold, with most of its action in downtown. Austin continues to be a capital magnet, playing on its hip “Keep Austin Weird” theme, with $2.2 billion in new investment well distributed between the CBD and its suburbs. Overall, the Upper Midwest is displaying good balance between urban and suburban investment, especially in places like Indianapolis and Minneapolis. In the South-Central states, though the suburbs account for 87% of aggregate office investment.
Industrial. There’s no other way to say it: industrial investment in the center of the country fell off a cliff in 2016. Aggregate volume dropped to $12 billion, a shocking 45.4% decline year-over-year. For a region ideally positioned for the logistics of goods distribution, such figures are more than distressing, they threaten the survival of many smaller businesses. As might be expected, as overall volume fell investors reverted to the markets they are most familiar with and comfortable in. In the Central states that means first Chicago ($2.5 billion) and Dallas ($1.9 billion); these two hubs accounted for 36.7% of the region’s investment in industrial property. For now, secondary cities don’t seem to have much appeal. Investors determined to “find yield” are placing more capital in tertiary markets in the North Central states, where cap rates average 8.0%.
Retail. On a relative basis, retail did well in this region during 2016, hitting a total investment volume of $18.4 billion that was just 9.7% under the 2015 amount. Shopping centers attracted the greater investor interest, rather than stand-alone stores and high-street shops. This is in keeping with the sprawling suburban character of many of the region’s metro area. While Chicago ($3.9 billion) and Minneapolis ($1.0 billion) lead the North Central area, Dallas ($1.7 billion) and Houston ($1.3 billion) dominate the southern tier. Cap rates are relatively high, meaning that investors are demanding a significant risk premium. Nevertheless, investors are quite willing to go to tertiary markets in search of yield, with such markets representing 28.7% of total purchase prices, or $5.3 billion spent on 654 individual deals.