National and Macroeconomic Overview
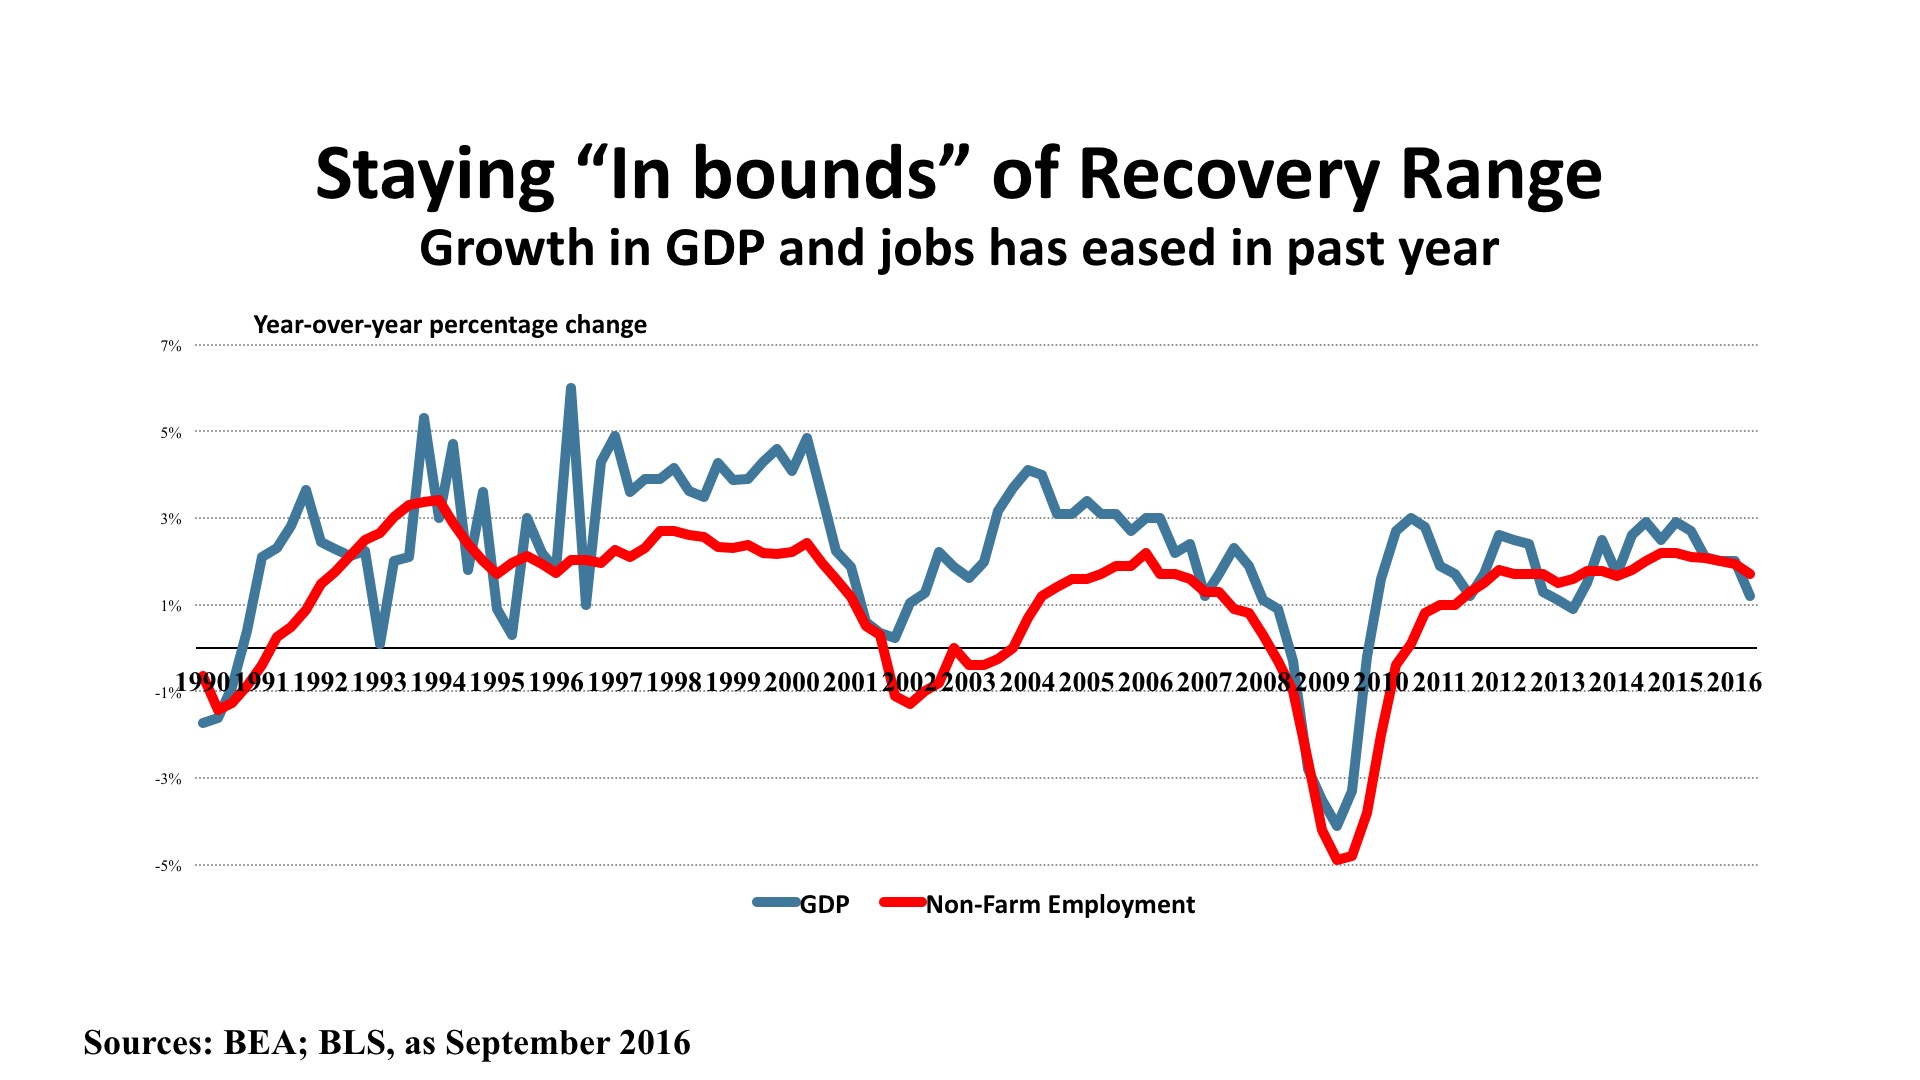
The Bureau of Economic Analysis “final” GDP estimate for the Second Quarter was released on September 29th, and showed overall economic growth at a 1.4 percent annual rate. This was the third consecutive sub-par quarter, and confirmed that the long expansion (now at 86 months in duration) is slowing its momentum. While the initial Third Quarter estimate will not be out until early November, preliminary data indicate continued sluggishness. Retail sales are up just 1.9 percent year over year. Housing starts, permits, and home prices slipped during the summer. Industrial production and capacity utilization are also in decline from 2015.
More positively, net real exports have risen for the last several months, and this should be strengthening GDP during the second half. The auto industry has also been trending upward. Incomes have started to rise, and for the first time in this cycle lower and middle-income households are benefiting materially, according to a Census Bureau study released in September. This is contributing to a small uptick in inflation, with core CPI now up 2.3 percent year over year.
Jobs. Employment growth has decelerated in 2016, averaging just 178,000 monthly through September. That’s a 1.7 percent annual growth rate, down from the 2.1 percent rate in 2015, but still enough to add 2,447,000 jobs to the economy for the 12 months ending September 2016. Business and professional services, healthcare, retail trade, and food services led the growth, indicating that job growth is positively spread across a variety of worker skill levels. The BLS “JOLTS” report (Job Openings and Labor Turnover Survey) shows twice as many workers quitting jobs compared with layoffs, indicating improving worker confidence. About 5.4 million job openings were reported in August (the most recent data published), and there were 5.2 million hirings that month. The unemployment rate stood at 5.0 percent, and has been relatively stable during the past year.
Policy. The Federal Reserve once again decline to push interest rates up at the September meeting of the Open Market Committee. Acknowledging the mixed economic signals, the Fed affirmed its accommodative monetary policy, awaiting evidence of stronger employment growth and a sustained inflation level close to its announced two percent target. It is worth noting that the Committee was split 7-3 on the question of raising rates. International influences remain critical in shaping policy, as the Brexit vote in the U.K. has triggered a steep decline in the Pound Sterling. U.S. fiscal policy remains in neutral, as this election year moves toward its “lame duck” period and uncertainty about the composition of political balance between the executive and legislative branches makes any near-term change unlikely in 2016.
Outlook. Improvements in household incomes, the stabilization of unemployment at a comparatively low rate, and an uptick in consumer confidence to its highest level since the Great Recession is prompting expectations of 2.5 percent GDP growth in the second half of 2016, followed by 2.2 percent growth during 2017. Personal consumption expenditures should help drive improved retail performance, and the jobless rate is projected to drop to the 4.6 – 4.9 percent range in 2017. This combination, in turn, should permit the Fed to nudge interest rates upward – although this has long been forecast and has yet to been seen in any meaningful sense.
Regional Conditions in the Central States
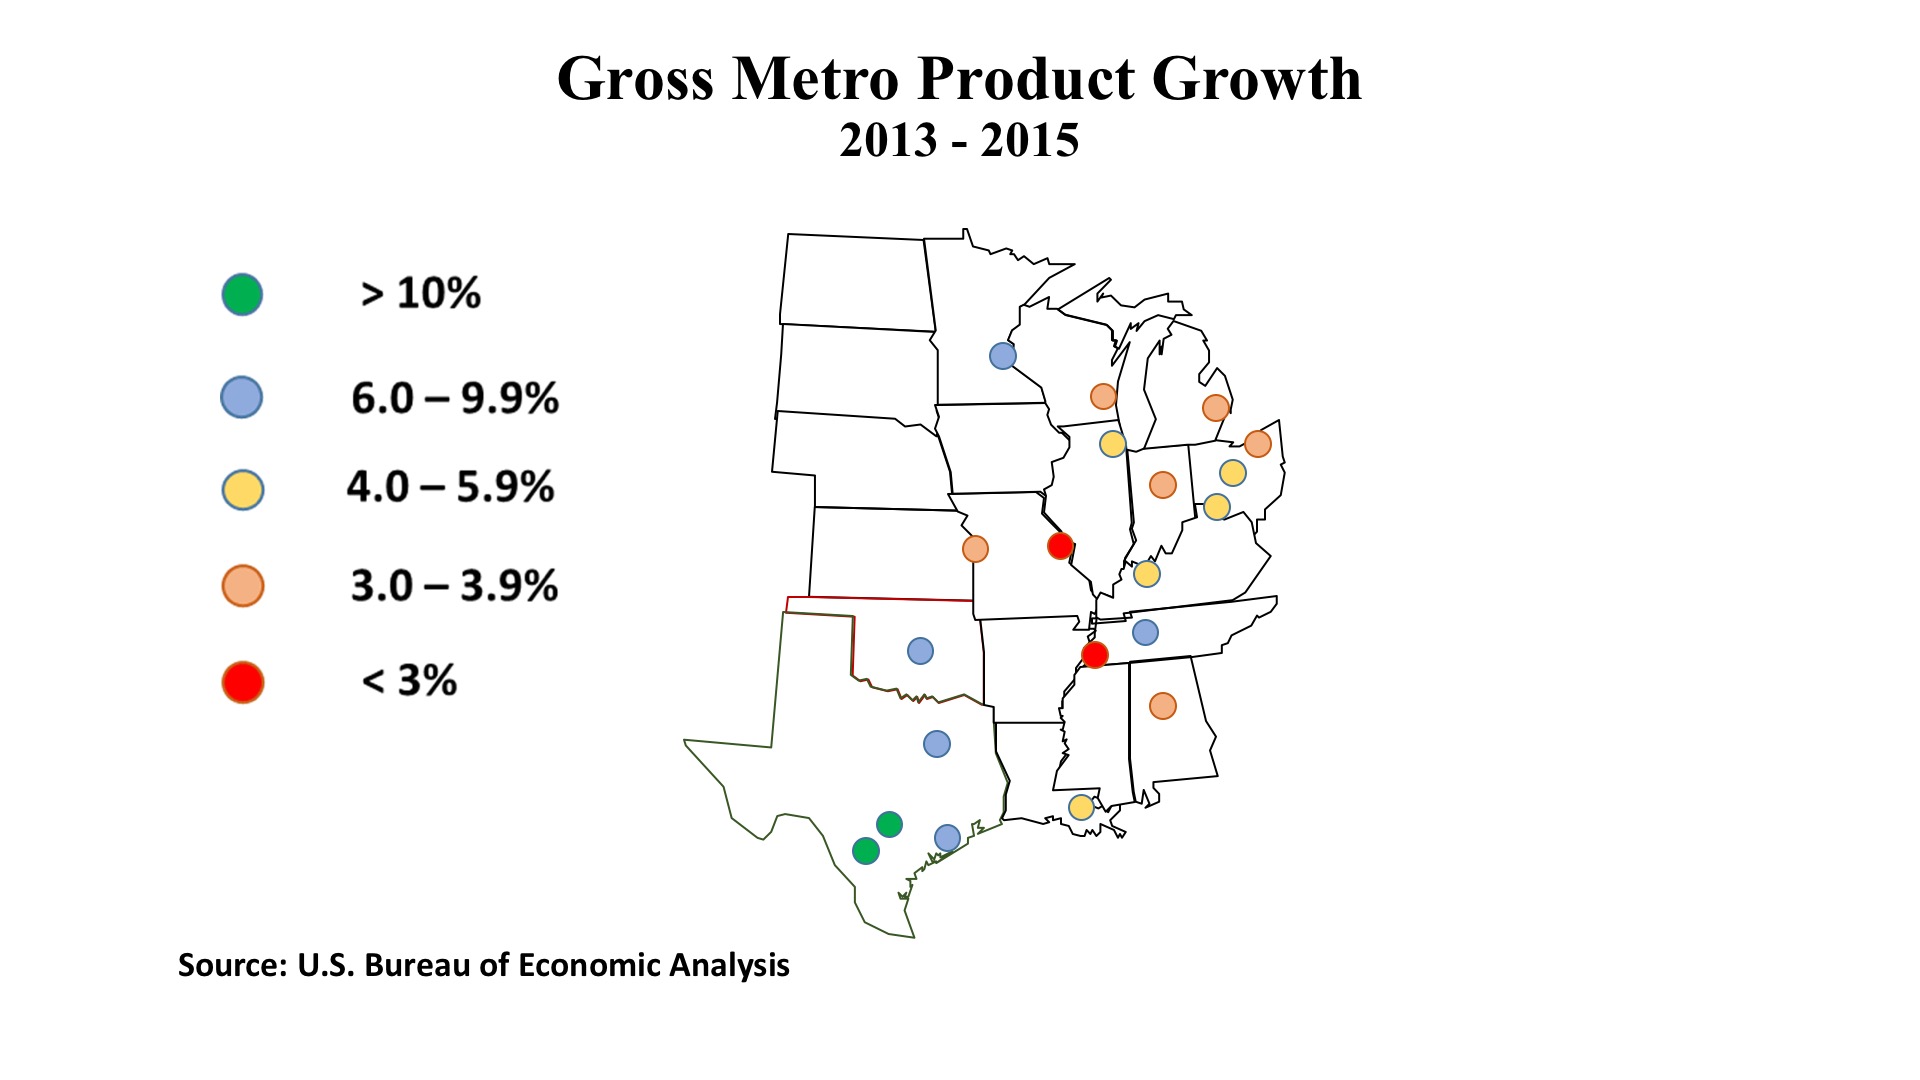
Twenty of the nation’s top 50 metro areas are located in the Central region and, on balance, these local economies are exhibiting above-average performance, as seen on the map displaying growth in Gross Metro Product (GMP) for 2013-2015. GMP is the local equivalent of Gross Domestic Product, the total output of goods and services in an area. This is a standard measure of economic activity and growth over time. Two Texas metros, San Antonio and Austin, were among only four markets nationwide that achieved more than 10 percent growth over the two year span. San Antonio expanded by 11.2 percent and Austin by 10.9 percent, stronger even than the solid performance of Dallas (7.9%) and Houston (7.4%) over the same period. With Oklahoma City posting a 6.5 percent increase, the major markets in the Oil Patch held up well during a timeframe when the energy industry was coping with declining prices by trimming payroll and reduction both exploration and production.
For the 12 months ending August 2016, Texas managed to post a net job gain of 190,600, demonstrating that the state economy has rounded out its industry profile nicely. Still, it is something of a shock to note that Texas’ 1.6% employment growth rate was not only a tick below the nation’s (1.7%), but two ticks below Michigan’s 1.8 percent job increase. In Michigan, that translated into a year-over-year job gain of 75,800. And proving that you shouldn’t believe everything you read in the papers or see on television, Ohio added even more jobs than Michigan, with the Buckeye State increasing by 78,300 jobs, or 1.4 percent. Tennessee posted the highest percentage increase in employment, 2.2 percent, as it grew its jobs base by 64,000. Five of the region’s metros expanded GMP between six and ten percent, and another five saw improved output in the four to six percent range for 2013–2015.
What is driving the region, if it is not energy? A review of Federal Reserve district bank reports reveals that the so-called “Rustbelt” state of Michigan, Ohio, Indiana, and Illinois are benefiting from the recovery of the auto industry, but also aerospace technology. There is still a specialty steel industry in the region, and steel prices have strengthened recently. Non-manufacturing activity plays an increasingly important role, and there are advantages to being in the Central time zone for functions like call centers. Minnesota and the Dakotas are growing this niche industry, taking advantage of the “neutral” accent of the Midwest that helps clarity of telephone communication. This is one factor helping those three states maintain unemployment rates below four percent, along with Nebraska and Arkansas.
Low unemployment can be a mixed blessing, though. Labor market specialists are concerned about difficulties in staffing, for occupations including commercial drivers, technicians, and experienced salespersons. There are far more positives than negatives for the Central region, and only two metros (St. Louis and Memphis) are seeing GMP lagging the U.S. norm since 2013.
Commercial Property Investment Trends
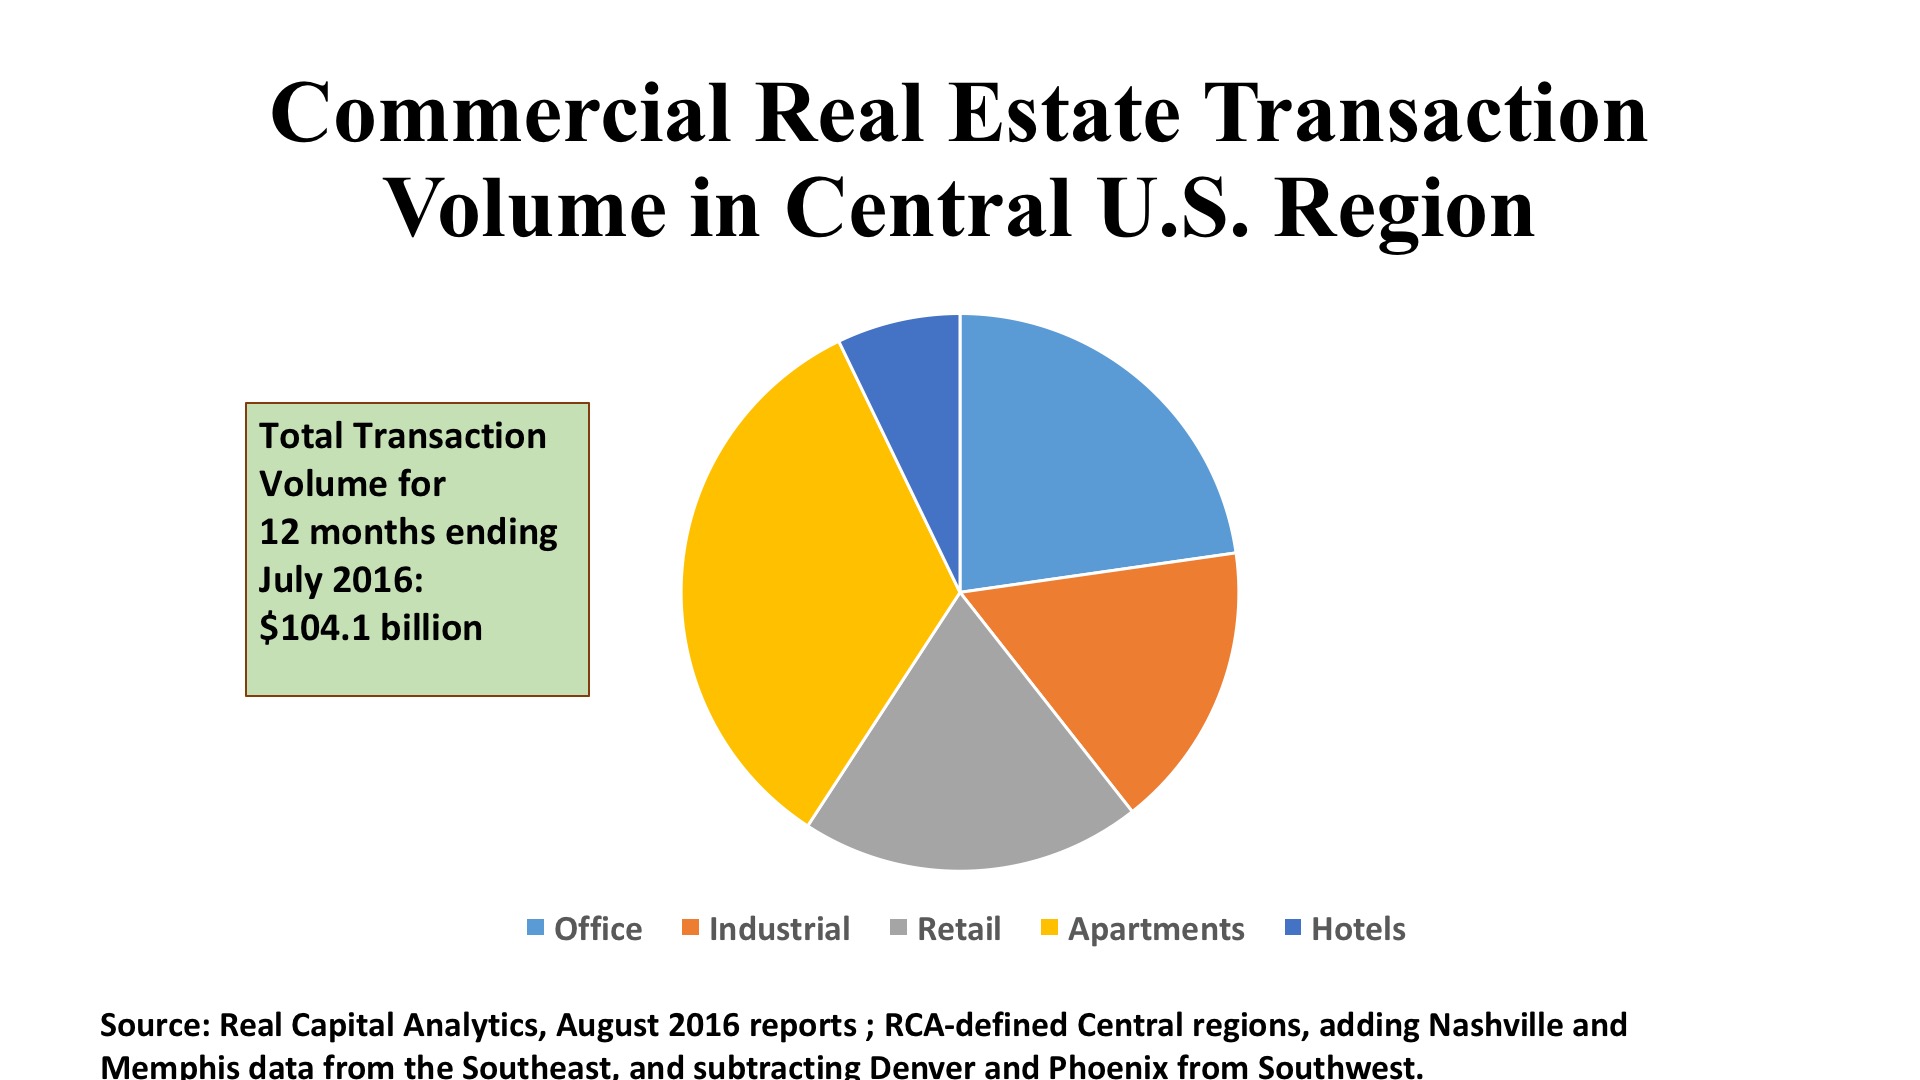
Office. Institutional investors have referred to their mental map of preferred locales for property as “the smile states.” That smile joins the two coasts with a swath of the Sunbelt from North Carolina westward to Las Vegas. Interestingly, that swath includes most of the high-GMP-performance metros in the Central Region. And indeed Dallas had $4.6 billion in office investment over the past year while Houston scored $1.8 billion and Austin followed closely with $1.7 billion in office deals. Together those three markets accounted for 35% of the Central region’s $23 billion in office transactions. By far most of those office assets were suburban properties. It is illustrative that a large Dallas CBD tower sold for $219 per square foot, while a large suburban office building was priced above $500 per square foot. The North Central states, however, posted $12.6 billion in office investment, about evenly split between CBD and suburbs. About half that total was directed to Chicago, and Chicago had $4.6 billion focused on its downtown, led by a $358 million acquisition in The Loop. Minneapolis CBD and suburban Indianapolis also had office properties sold for nine-digit prices. So the “smile states” metaphor may not be totally accurate in summarizing office investors’ preferences.
Industrial. With $16.9 billion in industrial property investment, the Central region accounted for 26% of all spending in this sector in the 12 months ending July 2016. The vast Chicago warehouse/distribution market alone saw $3.6 billion in industrial deals, averaging $60 per square foot and a 6.4% cap rate. Dallas had the next most significant investment volume at $2.9 billion, with its warehouses seeing a slightly higher $68 per square foot average price, but also a higher cap rate a 7.0 percent. Houston ranked third in the region, with $1.4 billion in aggregate price, and an even higher warehouse cap rate averaging 7.4 percent. Industrials had enjoyed tremendous favor amongst large investors for most of the decade, but enthusiasm clearly waned in the first three quarters of 2016. Nationally, industrial investment is off 34%, year-over-year, and all regions of the country have been affected.
Retail. The Central states tallied $20 billion in retail investment, which represented 19.2% of all commercial property sales in the region. By comparison, shopping properties accounted for just 14.4% of all sales in the East, and 17.2% of transaction prices in the West. Investor preferences weighted strongly toward neighborhood/community centers in the South Central but was more evenly balanced with mall and high street assets in the North Central states. In the Chicago metro, for instance, both malls and smaller centers exceeded $2 billion in deal volume, although malls were priced much more aggressively and high street assets transacted at a premium. Both Dallas and Houston saw strip malls avidly sought, each metro generating more than a billion dollars in transactions, and pricing at 7.1% cap rates. Beyond the largest metros, Austin, Kansas City, and Minneapolis all showed significant levels of retail property acquisition.