National and Macroeconomic Overview
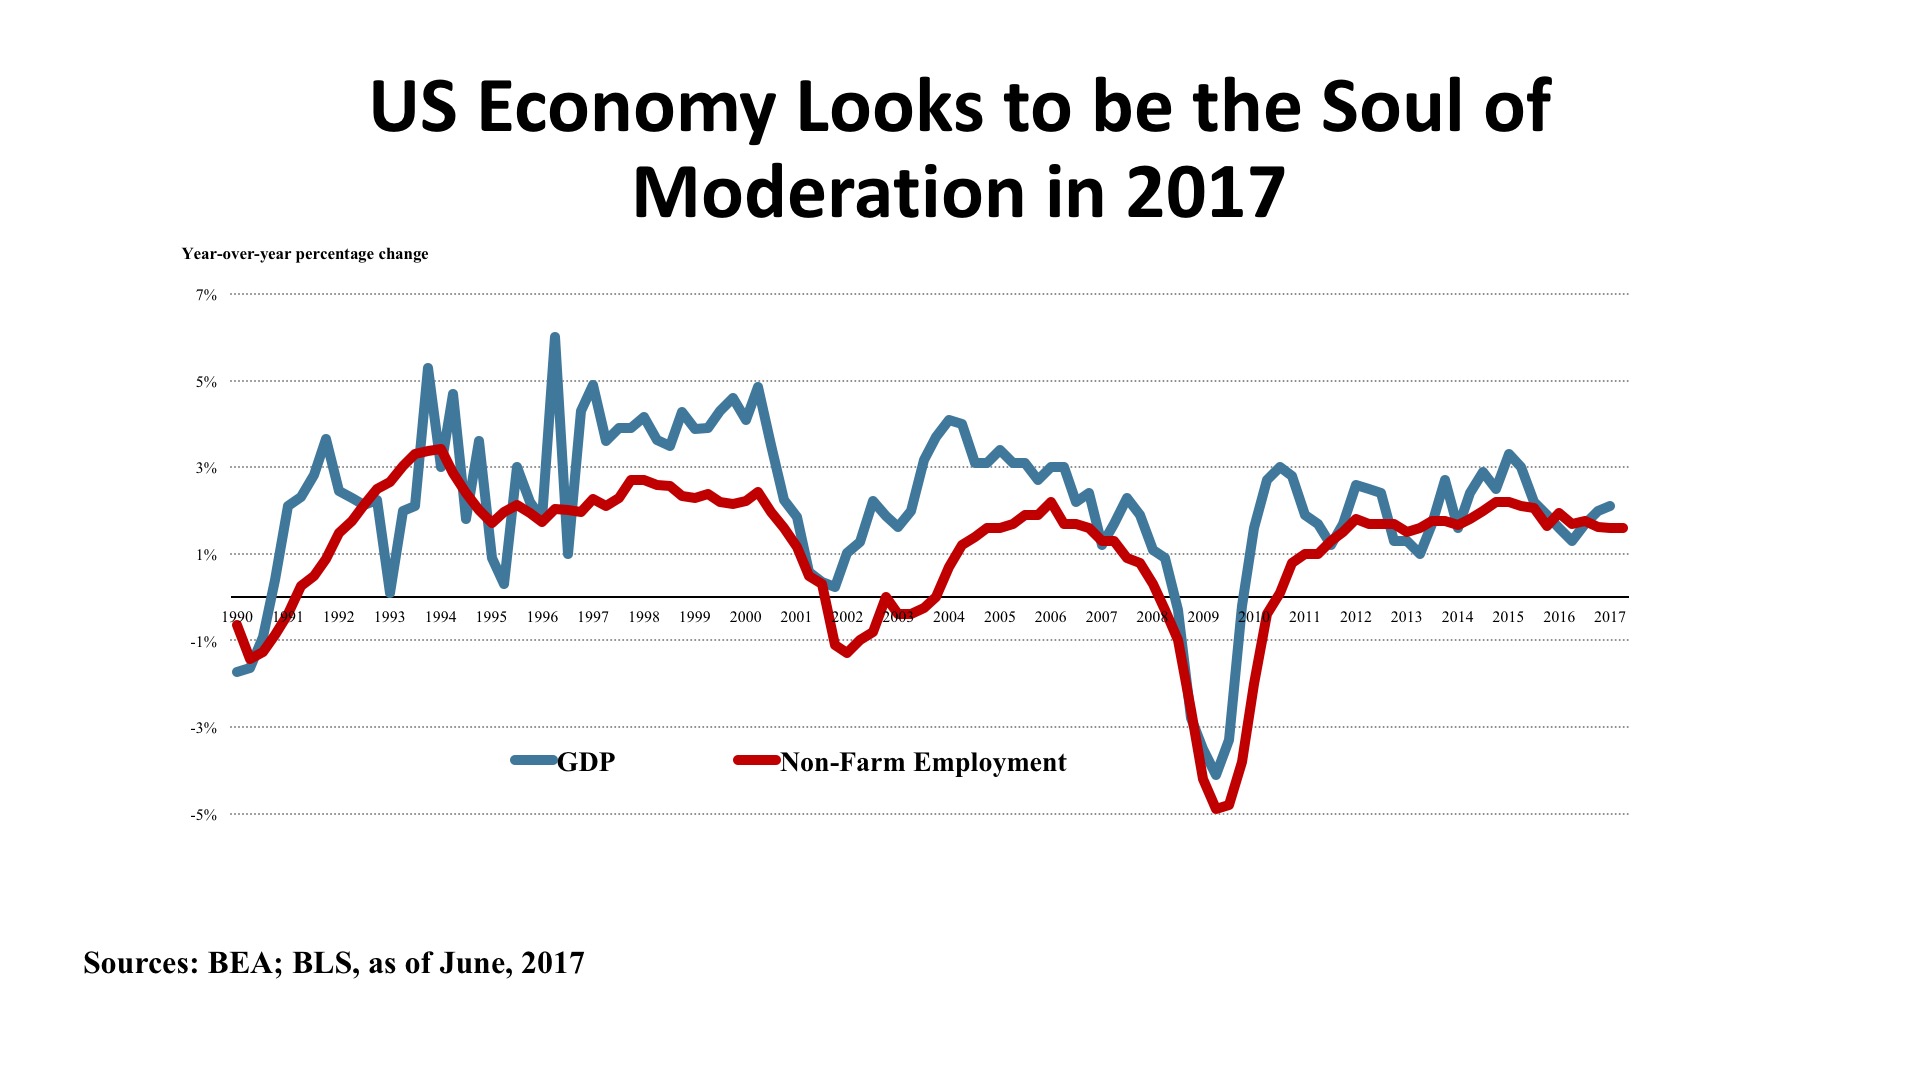
There is no more recurrent question posed in real estate analysis than, “Where are we in the cycle?” The mood amongst economic forecasters can best be described as “benign.” While there is a general consensus that the present expansion is getting long in the tooth, at 96 months and counting, most (correctly) assert that business cycles do not die of old age. For the record, this is already the third longest upcycle since 1850. But it is also the weakest since World War II. The upcycle of the 1990s reached 120 months, but averaged 3.6% annual real GDP growth over that decade. The recovery since the Global Financial Crisis has averaged a bit under 2.1% annually. Given slower labor force growth (even absent a lower participation rate) and decelerating productivity improvements, the baseline growth in the years ahead appears to be in the 1.7% - 1.9% range. Expectations of a return to the growth of the 1990s simply cannot be justified in the numbers.
Some comfort is being taken by the absence of typical signs of economic overheating that often precede recessions. Inflation remains quiescent, with low energy prices driving prices at the gas pump down to near $2.00 per gallon during the peak summer travel season. The Federal Reserve has been gradually raising its benchmark rates, but is being careful to avoid squeezing economic growth in the process. The “Trump Bump” in stock prices has shown staying power on Wall Street, but as the year advances it becomes clearer that the agenda of tax reform, infrastructure spending, Dodd-Frank rollback, and entitlement reduction will not be accomplished in 2017. Hence, there is probably greater fragility in the economy than the consensus acknowledges and risk is present from either domestic disappointments or international disruption.
Jobs. There seems to be a healthy fluidity in the labor markets, with the Bureau of Labor Statistics JOLTS (Job Openings and Labor Turnover Survey) showing job hires (5.5 million) well matched to job openings (5.7 million), and the number of voluntary separations (“quits”) at 3.2 million running roughly twice as high as layoffs and discharges (1.7 million). The unemployment rate was 4.4% as of June, its fourth consecutive month at 4.5% or less. Overall job growth averaged 180,000 per month during the first half of the year, and the Blue Chip Economists forecast slippage to a 166,000 monthly average for the balance of 2017.
Office sector demand has been bolstered with business and professional service employment rising by 625,000 year-over-year while financial service gained 169,000 jobs. Transportation and warehousing employment is up by 97,000, largely due to e-commerce (although this did limit retail job growth to just 20,000). Manufacturing eked out a 49,000 job gain, but construction activity posted a substantial job increase of 206,000 over the twelve months ending June 2017.
Policy. As of this writing, six months of efforts on healthcare reform (“repeal and replace”) have gone nowhere, and the legislative and executive focus on this pivotal issue created a logjam affecting all other elements of the domestic policy agenda. Most of the key tax cut items contemplated in the brief outline released by the White House in April were held together by the linchpin of purported savings in the failed Healthcare package considered by the House and the Senate. Without those savings, the tax plan either significantly increases the Federal operating deficit or requires draconian cuts to discretionary domestic spending. Either choice faces difficulty on Capitol Hill. The next immediate policy hurdle is the requirement to pass a budget and approve a debt ceiling increase in September, or else risk a government shutdown. “Who knew it would be so complicated?” In all probability, Washington will muddle through, as there is little upside to a pitched battle on policy at this point. Still, the high hopes many had for substantive change are facing a disappointing reality check and 2017 appears to be less the beginning of an era of disruptive change and more a story of “the same old same old” to those outside the Beltway.
Outlook. There is a very narrow range in forecasts for key variables in the economy: GDP growth; unemployment; personal consumption expenditures; trade balance; housing starts; vehicle sales; all are basically projected to continue recent trend lines. The difficulty is that while expectations are linear, risks are non-linear. Asset pricing in real estate as well as in the stock market is high, and investment volume is being driven more by the pool of capital than by earnings fundamentals. While some are extolling a “Goldilocks” condition in the economy, potential surprises are asymmetrical at this point – more likely on the downside than the upside – with risk managers now speaking more frequently about a possible “Black Swan” as the trigger for cyclical change.
Regional Economic Conditions
The Central States are a study in contrast at mid-2017. On the positive side, Texas leads the nation in year-over-year job growth, with 266,600 additions representing a 2.2% growth rate. Several states can boast jobless rates of 3.5% or lower: North Dakota (2.0%); Indiana, Wisconsin, and Nebraska (2.8%), Iowa and South Dakota (2.9%), and Arkansas (3.3%). But many of the same states (Indiana, Iowa, both Dakotas, Nebraska) are lagging the nation in income growth as of early 2017, according to the Bureau of Economic Analysis. Minnesota, Illinois, and Kansas are also subpar in personal income growth when compared with the U.S. averages. So it is not just a question of the number of jobs, but the quality of the jobs.
Often called “America’s Breadbasket,” the Central states have vast acreage devoted to agriculture. Farming is a major component of the regional economy, and for the U.S. stands as one of our few net-positive export industries. Drought, severe storms, and record heat are making this a difficult period for agriculture. Meanwhile those states that depend upon oil and gas extraction as a key part of the economic base are coping with low energy prices (West Texas Intermediate crude oil was $48.17 per barrel in the Second Quarter 2017, according to the U.S. Energy Information Agency). Nevertheless, other economic sectors including information technology, some manufacturing, business and professional services, and construction are more than compensating for softness in other sectors.
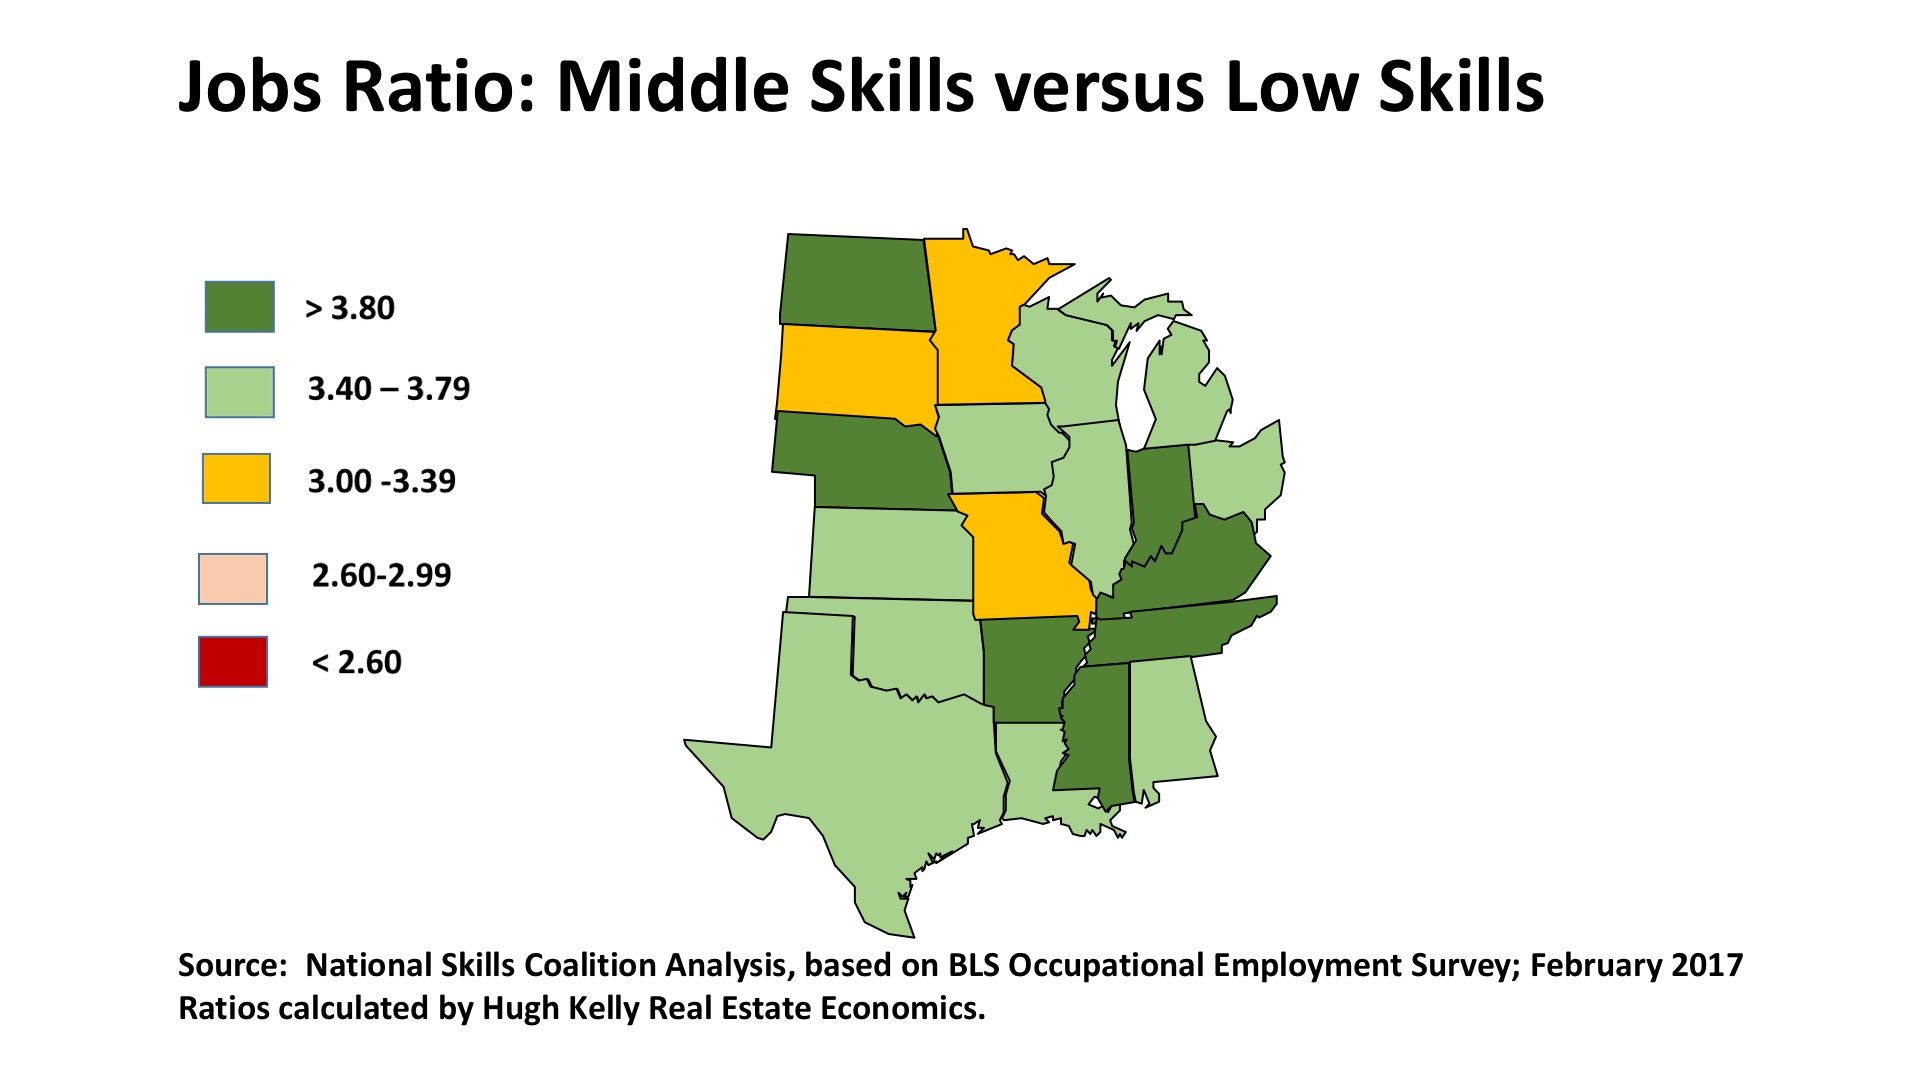
Looking forward, the Central States are particularly well positioned as tight labor markets evolve. That’s because seven of these states have ratios of 3.80 or more when middle skill jobs are measured against low skill jobs. As the accompanying map shows, most of the remaining states in the region have a ratio of 3.40 or higher. Middle skill jobs require a high school education but not necessarily a college degree. These jobs are prevalent in construction, building systems, transportation, and even in technician jobs in healthcare. Such jobs represent about 54% of U.S. occupations (high skill jobs are about 30%, and low skill jobs are 16% of the national total). Economic mobility in the future may come largely from workers’ ability to migrate from lower skilled job, which pay less and are more vulnerable to automation or outsourcing, to middle-skilled work. Thus the Central region can foresee significant opportunity to upgrade job quality and earnings if they capitalize on this feature of its economic structure.
Commercial Property Investment Trends
Now that we are solidly six years into a favorable real estate cycle, the velocity of investment transactions is easing. Nationally, office deal volume is off 5% from a year ago while retail is down 20%. Industrials, however, are holding their own. There seems to be an abundance of capital seeking a home in commercial property, but high prices are constraining buyer interest and sellers are asking what their re-investment strategy might be if they chose to take profits at the present moment. As rents have returned to pre-crash highs and vacancy has tightened, investors are seeking higher cash returns now and relying on speculative income and appreciation improvements less. Nevertheless, pricing has remained strong even if deal flow has ebbed. The evidence suggests great discipline in the market. The question is: can it last?
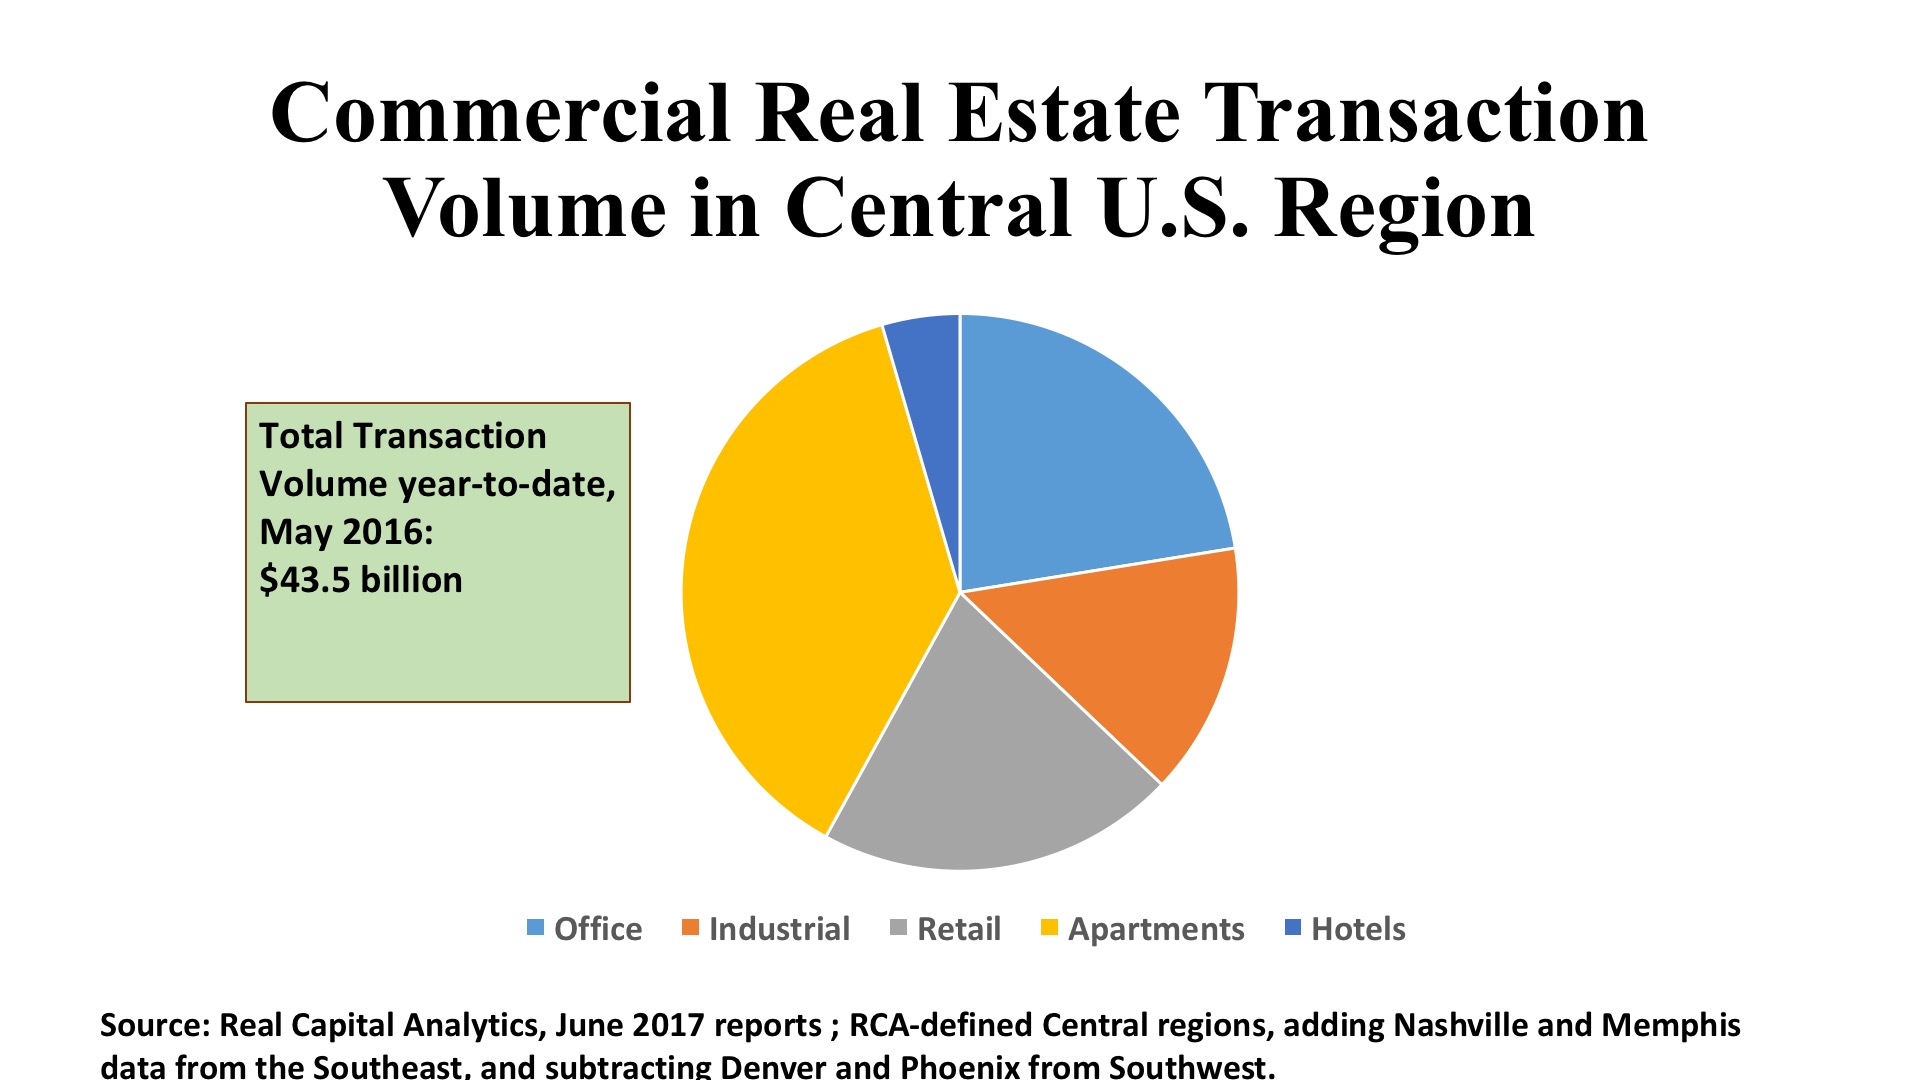
Office. With office transaction volume in the region down to $10.4 billion in early 2017, just a 21% share of total investment in this property sector nationally, the Central Region is clearly part of the national trend of reduced velocity in commercial real estate deals (down 15% in the aggregate compared to this time last year). Troubling headlines about the oil business notwithstanding, Houston led the region in total office investment at $1.4 billion, virtually all in its suburbs. Dallas, too, had robust activity ($857 million), again with an exclusive bias toward suburbs. Indeed, of all the markets in the region, only Chicago had more investment in its CBD than in suburbs, $584 million downtown versus $398 million elsewhere in the metro. The only other market with more than a half-billion in early 2017 office investment was Austin with $204 million in the CBD and $474 million in its suburban areas.
Industrial. The Central States registered a better share of total industrial property purchases, with $6.8 billion in volume accounting for 31% of the U.S. in this sector. The more vibrant Dallas warehouse/distribution market propelled it to first place in the region, ahead of Chicago. Dallas saw $1.1 million in 112 industrial transactions through May, ahead of Chicago’s $953 million in total price (although Chicago’s deal count was 113 – one more than DFW). It is not just a question of the major hubs and ports, though. Virtually all metros with interstate highways intersecting captured industrial investment attention with $150 million or more in transaction volume. And Real Capital Analytics recorded significant activity in so-called “tertiary markets,” with $718 million directed to such markets in the Midwest and $503 million to similar markets in the Southwest.
Retail. With total shopping center and store volume of $6.9 billion, the retail sector edged ahead of the industrial sector year-to-date in the Central States. At a capture rate of 27% of this property type’s national investment total, the Central region can be said to be holding its own, even as Retail adapts to profound economic stresses in a vastly changed pattern of consumption across the country. Chicago, far and away, posted the highest investment volume at $1.2 billion, about two-thirds in shopping centers and one-third in its stand-alone store inventory. Both Dallas and Houston had about $650 million in retail acquisitions – roughly half of the Chicago total – but these major Texas markets were more heavily weighted toward suburban centers rather than high-street retail. Interestingly, Detroit’s economic comeback has prompted activity in its stand-alone store assets, which accounted for 86% of its $294 million in retail property investment. Finally, the largely low-density profile of the region makes for opportunities in “small town America”, and tertiary markets in the Midwest and Southwest tallied nearly $1.6 billion in 190 retail deals during the first five months of 2017.