National and Macroeconomic Overview
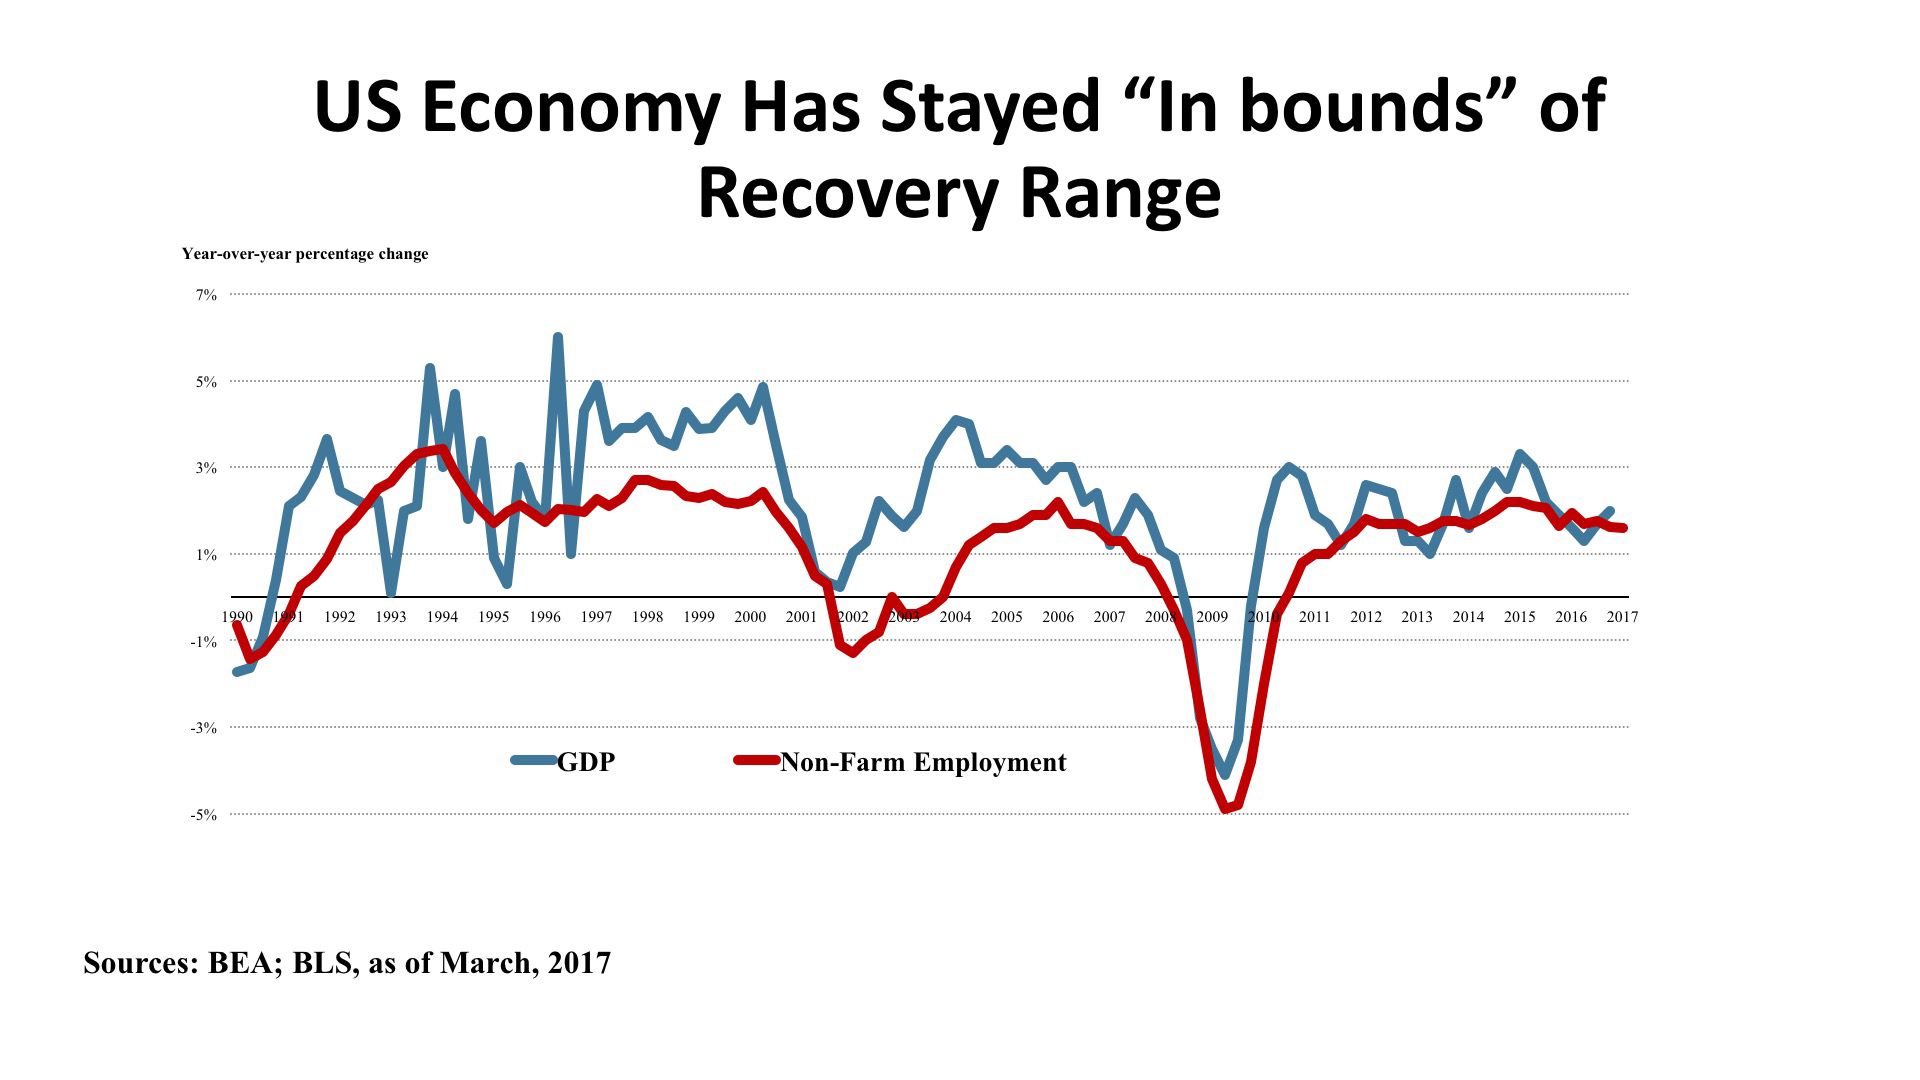
Sentiment indicators such as consumer and business confidence, stock market indexes, and surveys from trade organizations such as the Institute of Supply Managers have hit highs not seen in several years. However, most “hard data” measures have stayed stubbornly within the bounds that have characterized most of the recovery period since the Great Recession. Real consumption actually declined both in January and February. Industrial production is up just 0.4% year-over-year, as of figures released late last month, although it was utilities rather than manufacturing that showed weakness. Government press releases notwithstanding, the trade deficit is right in the range it has been since 2010. All told, then, the Blue Chip Economists’ forecast is for a meager 2.2% expansion of real GDP in 2017, followed by a scarcely better 2.4% in 2018.
Jobs. As this newsletter has been discussing for some time, demography has collaborated with the economy in putting steady downward pressure on the unemployment rate. The “headline” rate hit 4.5% in the Bureau of Labor Statistics’ most recent tally, the lowest level since 2007. There has been a saw-toothed pattern of net job growth, however, as hiring has confronted reduced slack in the labor force. We should not make too much of the comparatively weak job gain in March (98,000), but the year-over-year employment numbers have been stuck in the 2.2 to 2.4 million range for six months now, and the percentage increase March 2016 – March 2017 was just 1.5%. The numbers are hinting that the employment cycle might have peaked as early as January 2015 for this recovery. If “jobs, jobs, jobs” is the prescription for real estate demand, as for the economy as a whole, close attention to this Spring’s BLS reports is clearly warranted.
Policy. The expectation that the new Trump Administration would capitalize on its “First 100 Days honeymoon period” to advance a policy menu of lower taxes, less regulation, an infrastructure boom, and healthcare reform has met with decidedly mixed results. Executive orders have indeed loosened regulatory constraints, and a strongly stimulative Defense Department budget will provide a boost to many parts of the country (see this issue’s map for detail, and the regional economic discussion below). But the American Health Care Act fizzled without making it to a Congressional vote – hobbled by opposition from both the right and left, and doomed by a Congressional Budget Office analysis showing as many as 24 million losing coverage. Tax reform will not be easier (it never is). The infrastructure outlook depends upon appropriations that seem wholly dependent upon the budget implications of the as-yet uncertain tax bill. Monetary policy, meanwhile, appears to be on a long-awaited course of Fed tightening in a move away from the zero-interest-rate bound of 2009 – 2016. Policy coherence remains in short supply, in other words, and may remain so until some spirit of compromise arrives in Washington.
Outlook. The consensus of Blue Chip Economists for moderate growth in the range of 2.2% - 2.4% in 2017-2018 is actually slightly weaker than three months ago. Unemployment is expected to stay low, but inflation is now expected to edge upward and exceed the Fed’s two percent target, and possibly rise above 3% briefly during 2017. Wages can be expected to tick upward under these conditions, and households’ disposable income would improve. Bond rates will be rising – increasing business borrowing costs and constraining investment. And home mortgage interest rates will likewise increase, taking some steam out of the housing recovery. So the outlook is mixed, but risks to the downside are increasing.
Regional Economic Conditions
Extrapolation is a persistent temptation for economists, leading to forecasting out of the rear view mirror. Stresses over the past several years in key industry sectors in the Central states have meant an unaccustomed slowdown of growth in many key states. But this now appears to be changing as the forces shaping manufacturing, agriculture, and energy either find their bottoms or begin to accelerate from a period of sluggishness.
The precipitous drop in energy prices, for instance, seems to have run its course. For the past year, crude oil prices have settled into a narrow range close to $50 per barrel. Expectations that economic growth will spur demand is encouraging an increase in rig counts in the Permian Basin and increasing exploration in the Bakken region further north. The multiplier effects of renewed energy industry growth are positive for the Central states as a whole. The year is beginning with fairly positive conditions for the Breadbasket, with strong prices for a variety of agricultural products, including soybeans, cattle, hogs, and winter wheat. Even the “rustbelt” is reporting optimism, according to recent Federal Reserve releases, with production picking up in aerospace manufacturing and in light truck production. None of this can be called a “boom”, but an increase in capital expenditures and plant expansions suggests corporations anticipating positive economic conditions this year and next. The risks at this point appear to be tied to trade, with a strong dollar constraining export growth and uncertainty about trade policy leading to an aura of caution around the core of optimism.
Over the past twelve months, the Central region has accounted for about one-third of the nation’s job growth. This is good as far as it goes, but subpar when compared with periods of regional economic strength. Texas is the single largest contributor to employment expansion in this region, with 218,000 jobs added over the past year. But this is a growth rate of 1.8%, not much different from the national average, although Dallas had a vigorous increase of 3.5%. Remarkably, Michigan matched Texas’ growth exactly. Tennessee posted the region’s highest growth in jobs, 2.3%, led by very strong employment trends in the Nashville metro. Missouri registered job gains of 2.1%, with Kansas City standing out with 2.7% growth. But a swath of states had flat to negative employment trends, including Kansas, Louisiana, North Dakota, and Oklahoma.
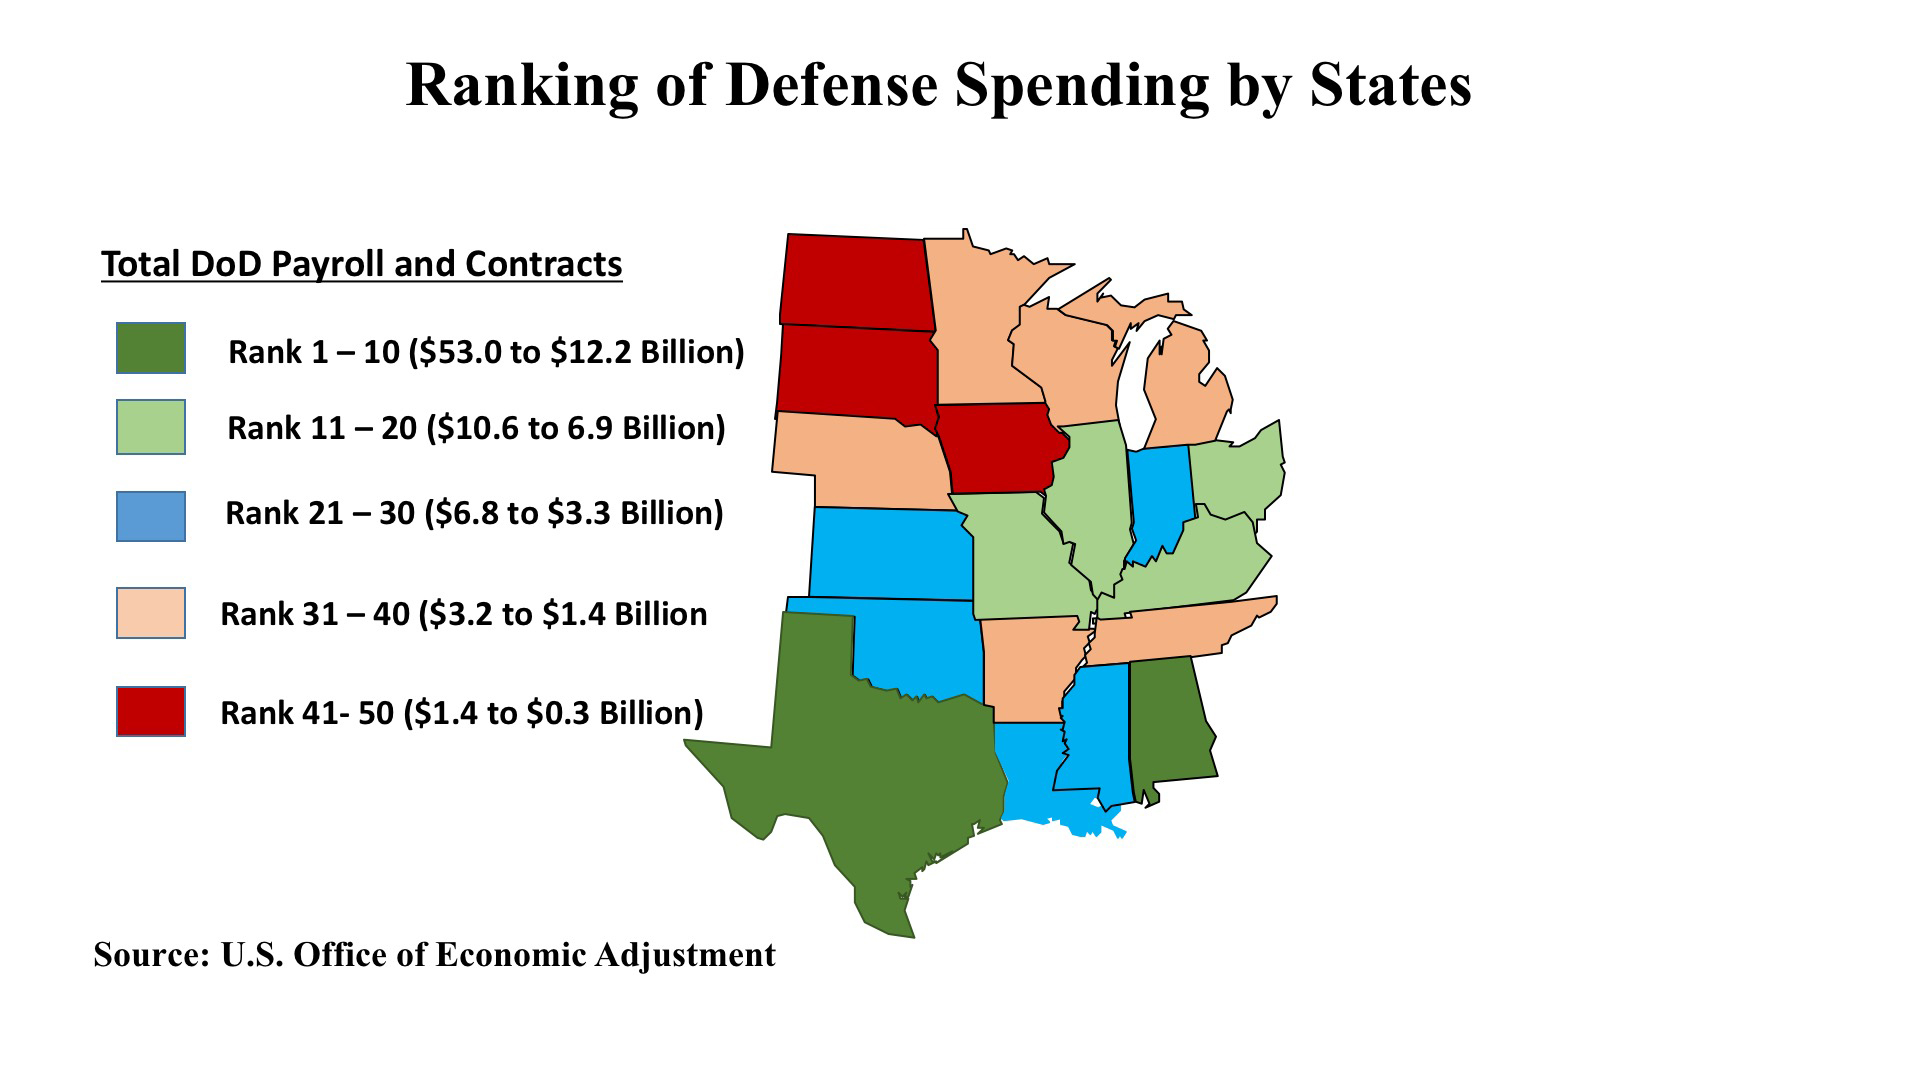
Going forward, the Central region should benefit from increased Department of Defense spending on personnel and military contraction. Texas and Alabama are ranked in the top ten states for defense allocations, with Ohio, Kentucky Illinois, and Missouri also well positioned to see spending stimulus.
As of the Spring of 2017, this region seems poised to take modest steps forward, in line with national expansion trends.
Commercial Property Investment Trends
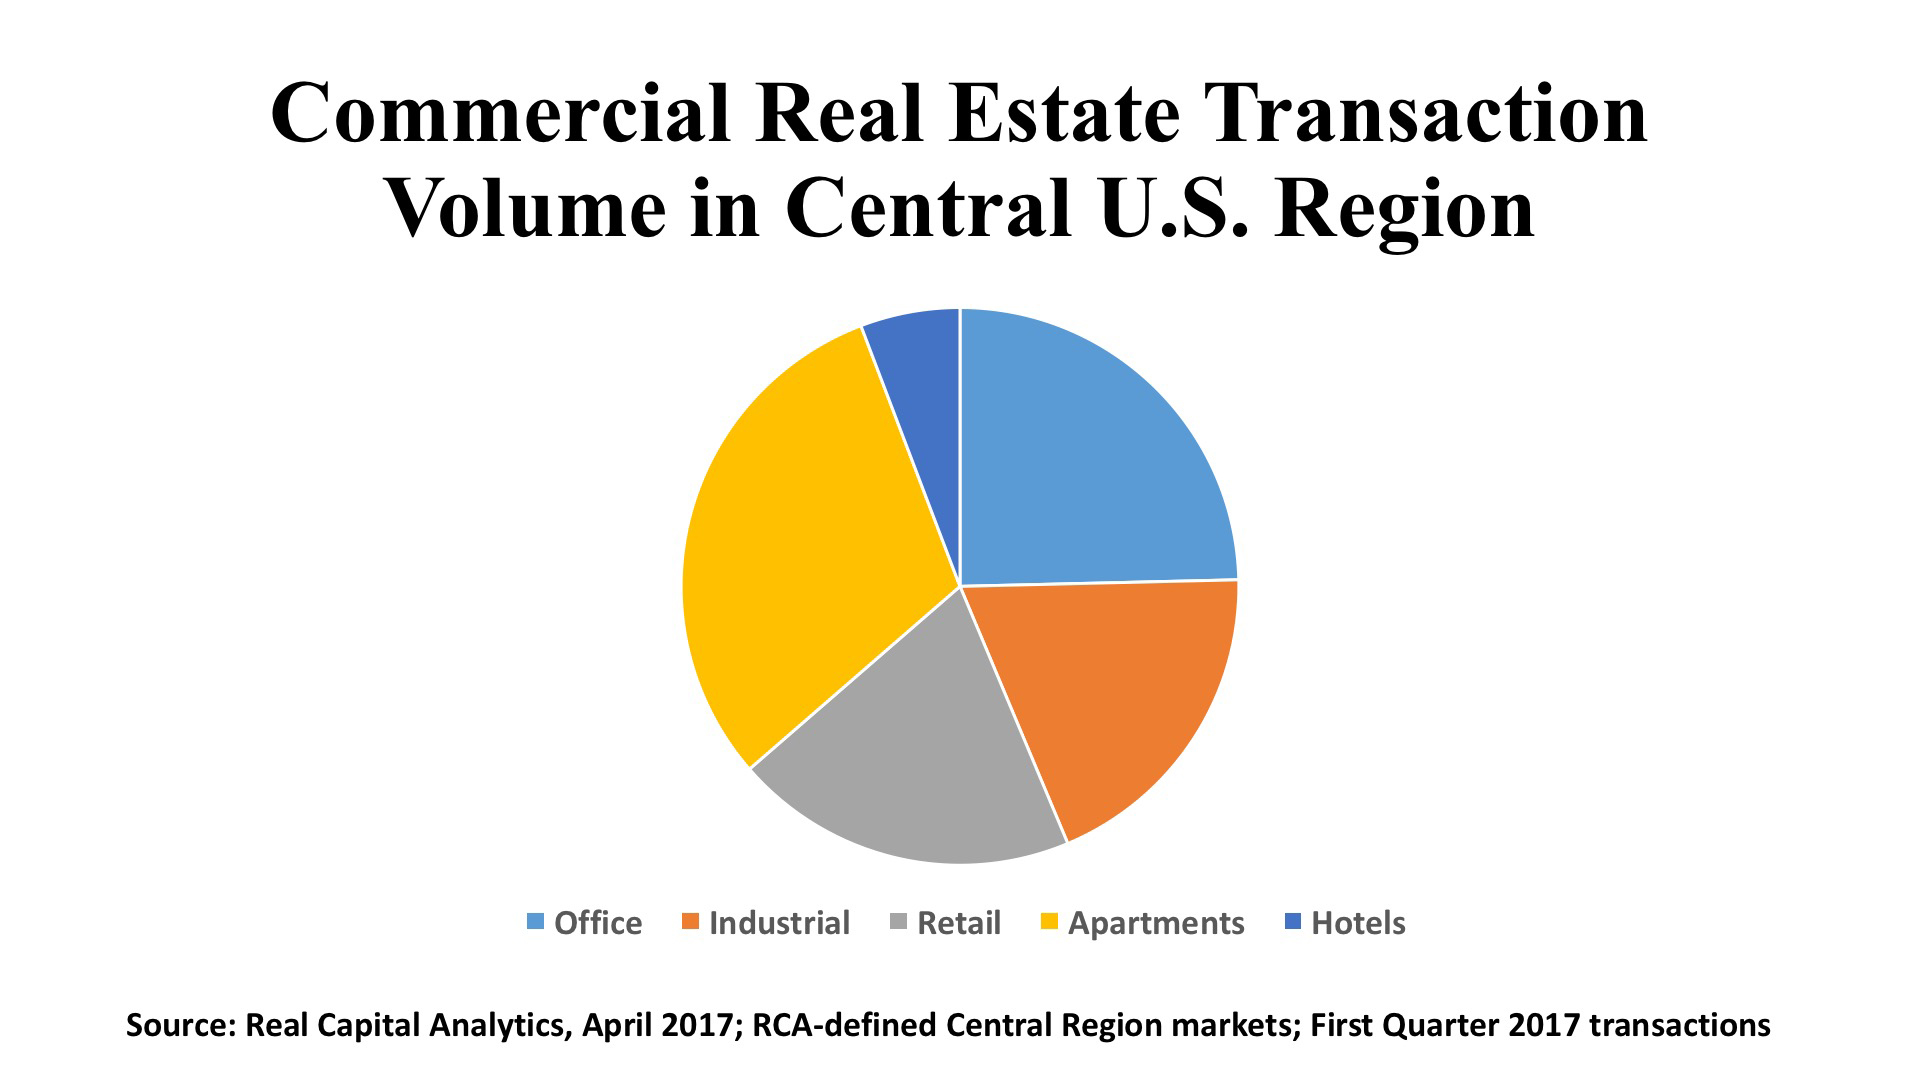
Real estate investment in the Central region is being swept up in the downdraft that has pushed transaction volume down almost across the board over the past 18 to 24 months. During the First Quarter of this year, the Central states saw $15.9 billion in property transactions across the five major sectors (office, industrial, retail, multifamily, hotel). This was a meager 17.9% of US transaction volume for the period. For the twelve months ending March 2017, the region’s total volume was $86.4 billion, or 19.2%, suggesting a recent loss in share for the Central states even as overall investment activity has been declining.
Office. Thus far in 2017, office transaction volume ($3.9 billion) is roughly on pace with 2013, 2014, and 2016 – but well behind the recent record level in 2015. Houston saw 32 office deals in the first quarter, generating $1.2 billion in aggregate price. Chicago approached the billion dollar threshold, with $949 million representing 31 properties. Dallas and Austin were also active, with $531 million and $446 million in volume, respectively. Cap rates for the region averaged 7.6%, according to Real Capital Analytics, a significant 90 basis points higher than the U.S. mean. Buyer groups were well distributed, with private investors having a 34% share, institutional investors 25%, and cross-border investors 29%. Of the international purchasers, buyers from Canada, the UK, and China were most notable.
Industrial. The Central states captured a 22.1% share of US industrial transaction volume during the First Quarter, with just above three billion in aggregate investment generated by 313 deals. This was just a shade below the region’s 23.0% share of volume for the twelve months ending March 2017, showing that these states are holding their own in the industrial sector. The major warehouse/distribution markets of Chicago, Dallas, and Houston have been the most active investment targets, followed by Minneapolis, Indianapolis, and Nashville. Private investors have been far and away the dominant purchasers, accounting for 44% of the First Quarter transaction volume, with institutional investors taking second place with a 21% share. Owner/users followed with a 15% slice of the pie, with international buyers and REITs each contributing 10% of total volume.
Retail. With $3.2 billion in First Quarter transactions and $14 billion over the past twelve months, the Central states have generated about 19% of US retail property investment activity. While buyers mainly focused on the large markets (Chicago, Houston, Dallas), Detroit is emerging on the investor radar, with fifteen recent deals representing $301 million in purchase price. Detroit surpassed more-discussed metros including Nashville, Austin, and Minneapolis. At the same time, tertiary markets in the region continue to attract capital, as noted in previous editions of this newsletter. The buyer profile for retail differs from offices and industrials, in that REITs have a 35% share of First Quarter 2017 purchases, second to private equity’s 46%. Cap rates are a relatively aggressive 6.2% in markets like Austin and Dallas, while cities like Cincinnati, Cleveland, and Houston are somewhat more attractively priced at cap rates above 7%.
About TCN Worldwide
TCN Worldwide, a consortium of leading independent commercial real estate firms, provides complete integrated real estate solutions locally and internationally. With commercial real estate professionals serving more than 200 primary and secondary markets worldwide and representing over 80 million square feet of space under management, TCN Worldwide is one of the most comprehensive service providers in the industry. An extensive range of real estate services coupled with a personal commitment to exceed client expectations is what allows TCN Worldwide to be a leader in the commercial real estate industry.
TCN Worldwide ranks as one of the largest service providers in the industry, consisting of more than 5,500 commercial real estate professionals in 170 offices across 25 countries, and collectively representing more than $58.6 billion in annual transaction volume.