Overview of National Economic Context
The major macro-economic indicators. The First Quarter doldrums struck again in 2016. Relatively weak job gains in January (168,000 net new jobs for the month) were a drag on First Quarter totals, with the three-month employment increase at just 628,000. The pattern of the past several years has been economic acceleration in the Spring and Summer months. Year-over-year, U.S. employment gains exceeded 2.8 million, or 2.0%. Wages are starting to respond to the low five percent unemployment rate, with average hourly earnings up 2.3% for the year. These are “real” wage gains, as the CPI increase for the 12-months ending March 2016 was just 0.9%. Although recent increases in energy prices suggest some upward inflation to come, the US Energy Information Agency predicts that gasoline prices will average $2.04 per gallon nationally this summer, compared with $2.63 per gallon last year. That could buoy retail spending and vacation travel for consumers, which would be a welcome trend for the stores and hotels sector of the economy. The stock market gyrations certainly raised the level of nervousness across the economy. The VIX was high and the drop in the equities indexes during the first six weeks of the year was more than 10%. But since that "bottom", stock prices are up more than 15%. We are entering the Second Quarter with positive momentum.
The major policy indicators. The Fed looks like it has taken "defensive driving" courses to heart. As the central bank initiated the long-expected round of interest rate increases, the expectation was that we would see four 25 basis point bumps in 2016. The best estimate now is just two rounds of upward adjustments this year, and then only on the evidence of sustainable growth in jobs and output. During the presidential primary season, voter impatience with the domestic impact of globalization is making further expansion of free trade agreements increasingly unlikely. This could ripple through the US distribution system, especially around ports, signaling a slowdown in warehousing and logistics. Immigration is also a hot-button issue, and net inflows are down slightly since early in this decade – putting additional pressure on labor force growth. The mix of immigrants is also changing, with Asian inflows replacing Latin American as the largest source of new residents. The foreign-born population of the US, which numbered 45 million in 2015, is projected to reach 78 million by 2065, according to demographers at the Pew Research Center.
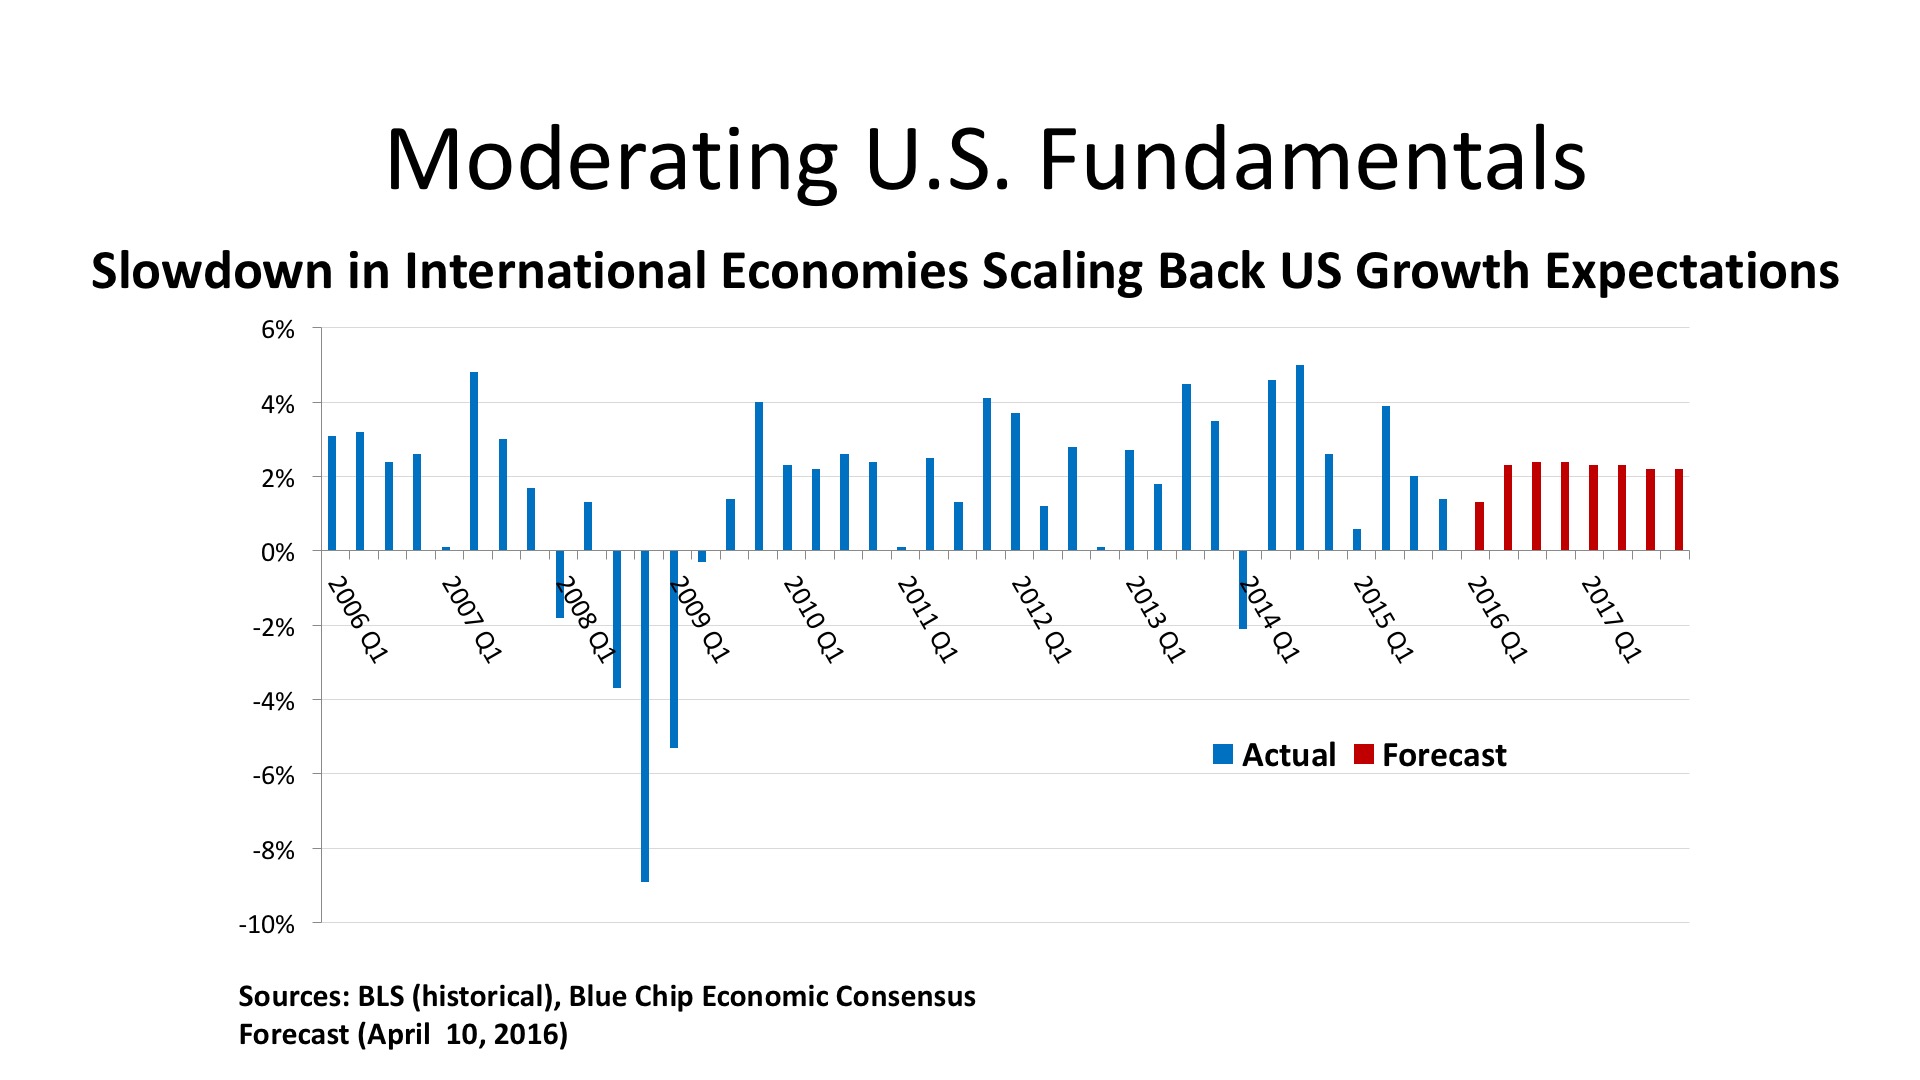
The Outlook. The Blue Chip Economists’ consensus forecast has pulled back on its growth expectations for 2016 and 2017, anticipating just a 2.0% real GDP advance this year, and 2.3% next year. Positive components going forward are moderate gains in retail spending, based upon job and wage growth, a moderate uptick in business investment as energy prices stabilize, and increases in homebuilding. Manufacturing should benefit as high levels of current inventory are reduced, but the strong US dollar is hobbling exports. Age demographics continue to constrain the labor markets, with Boomer retirements rising and Gen Y having passed its peak of labor force entry. The outlook for the unemployment rate is a reduction to the 4.5% - 4.6% range later this year and into 2017.
Regional Conditions in the Central States
Employment Trends. Twenty states are mapped in the Central Region of the United States. For the 12 months ending March 2016, these states added 746,000 jobs, or 26.6% of the nation’s job gain. But the Central region accounts for 39.2% of the nation’s jobs base, and so it lagged behind the U.S. employment growth rate of 2.0%, as the 20 states in aggregate had just a 1.3% growth rate. While Texas did add 186,000 jobs, that was just a 1.6% increase – slower, remarkably, than Michigan whose 97,000 new jobs represented a gain of 2.3%. The only other Central states with growth rates faster than the US were Tennessee (91,000 jobs; 3.2%) and Arkansas (25,000 jobs; 2.1%). Louisiana, North Dakota, and Oklahoma all posted job losses, and Kansas was absolutely flat (no pun intended) for the year.
There are, as always, notable cross-currents moving beneath the surface of the top-line numbers. The Federal Reserve’s April 2016 Beige Book report found labor shortages at both ends of the skills barbell. High-tech and engineering firms are scrambling to find qualified workers, and so are employers in low-wage industries like food service, hospitality, and healthcare services. The shift from labor surplus is even prompting corporations like Wal-Mart and McDonald’s to move their wage floors upward. Companies are increasing the frequency of wage reviews, hoping that small but repeated increases in pay will reduce employee turnover.
And, as oilfield workers suffer layoffs in the energy price collapse, they are shifting in significant numbers to construction jobs – which many of them held before the oil-and-gas boom of a few years ago. The energy-related fabrication companies themselves are looking to diversify their product lines, turning to equipment manufacturing, transportation equipment, and aerospace to make up for business lost to the decline in drilling rig counts.
Macro-economic conditions. At minimum, we should note that there are mixed signals coming from the Central states – some surprising and some not. It is unusual to find higher levels of business optimism in the North Central region than in the South. Although overall growth has slowed, the region is still expanding (at least in sixteen of the 20 states), and this is buoying the housing market. Interestingly, homebuilders and residential brokers are reporting that it is mid-priced housing – not McMansions – that is characterizing the healthiest sector for single-family homes. On a positive note, residential investment is being supplemented by higher levels of capital expenditures (again principally in the northern tier of the region) by businesses spending to expand, to improve productivity, or simply to upgrade equipment suffering from obsolescence.
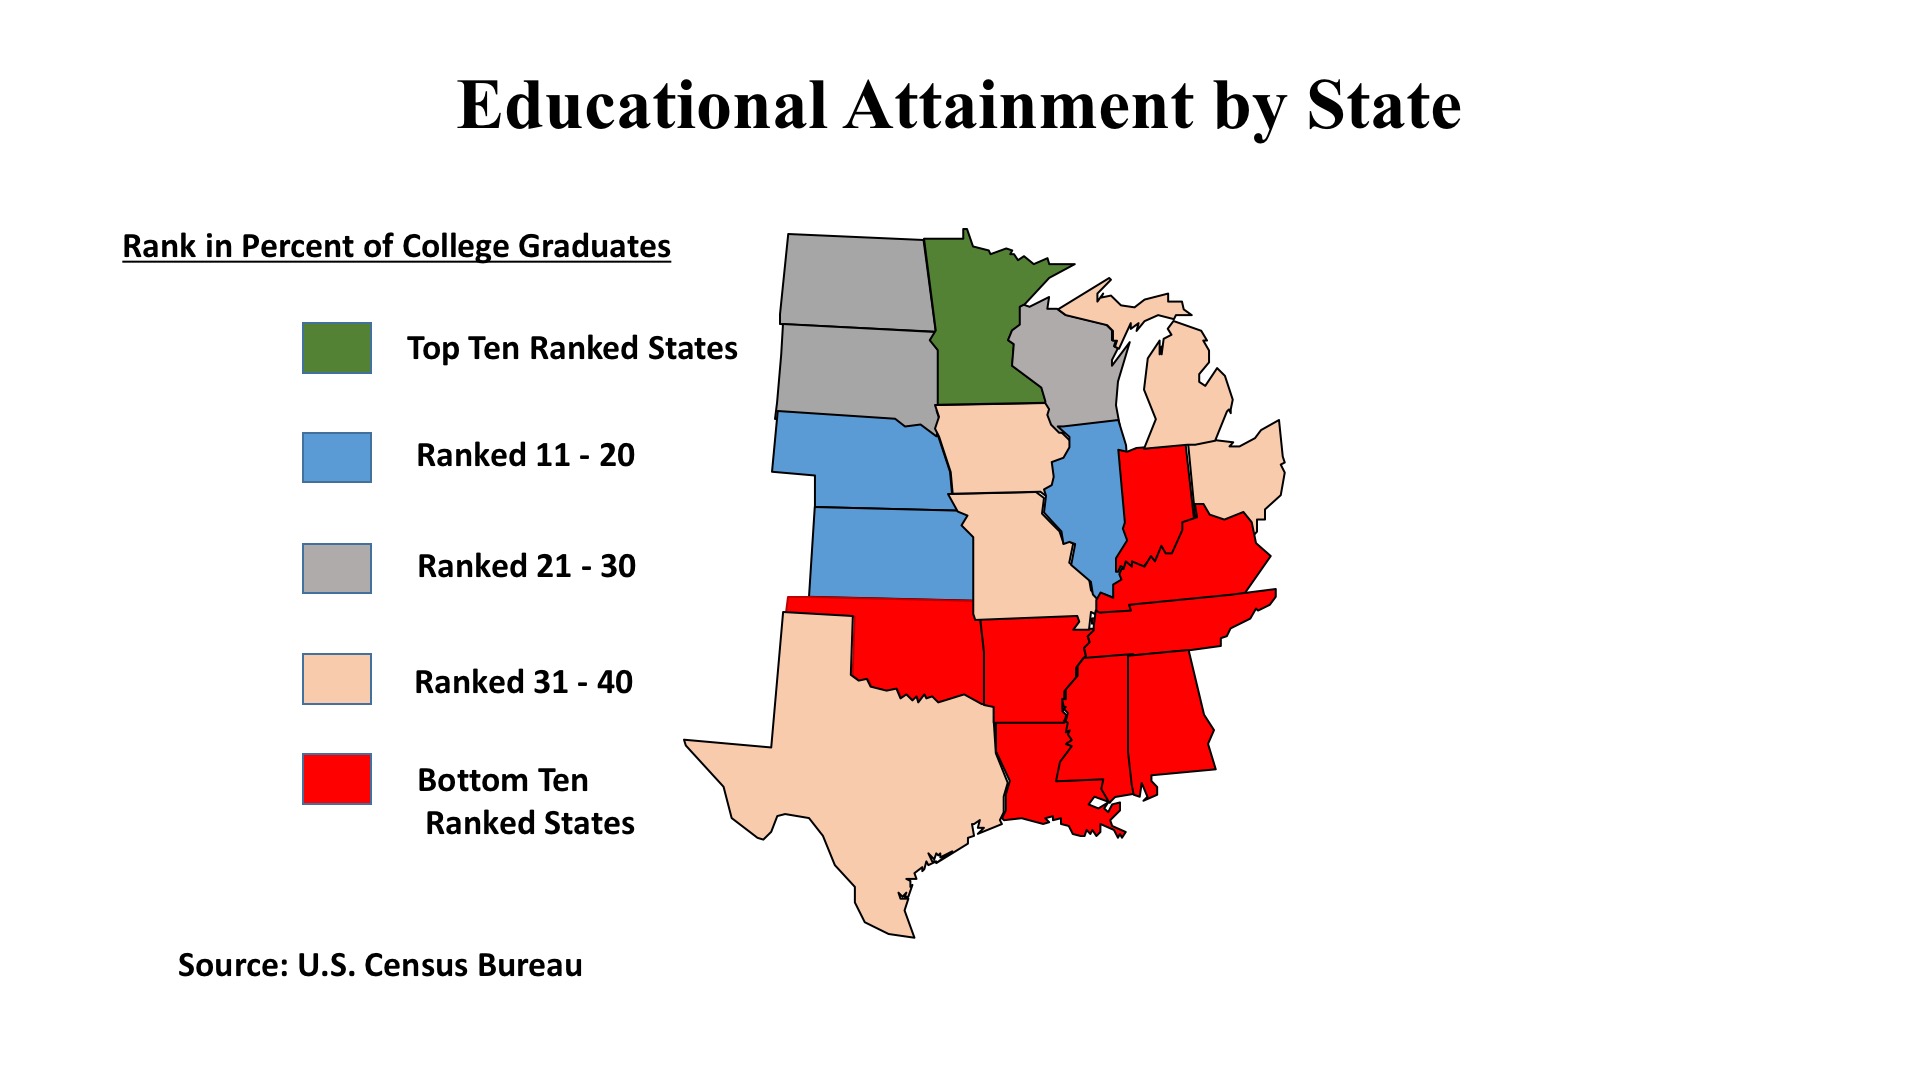
Of greater concern is evidence that freight volumes – by truck, by rail, or by air cargo – are down. This is a region of the country where goods-handling is a basic economic function – as hinted by the educational attainment levels displayed in the accompanying map. Some of freight decline may be attributed to the strong US dollar’s impact on trade. Indeed, both along the Mexican and Canadian borders there are reports of slower retail sales because of the exchange rate. Tourism along the borders has also slowed because of the strong dollar. Some had thought that lower gas prices would readily translate into higher household spending on other items, but that has not generally happened. It turns out that families who tightened their belts in the Great Recession learned a lesson in budgeting, and if their mental account for gas was in surplus, that did not prompt them to immediately apply that cash to purchases at the mall.
Commercial Property Investment Trends
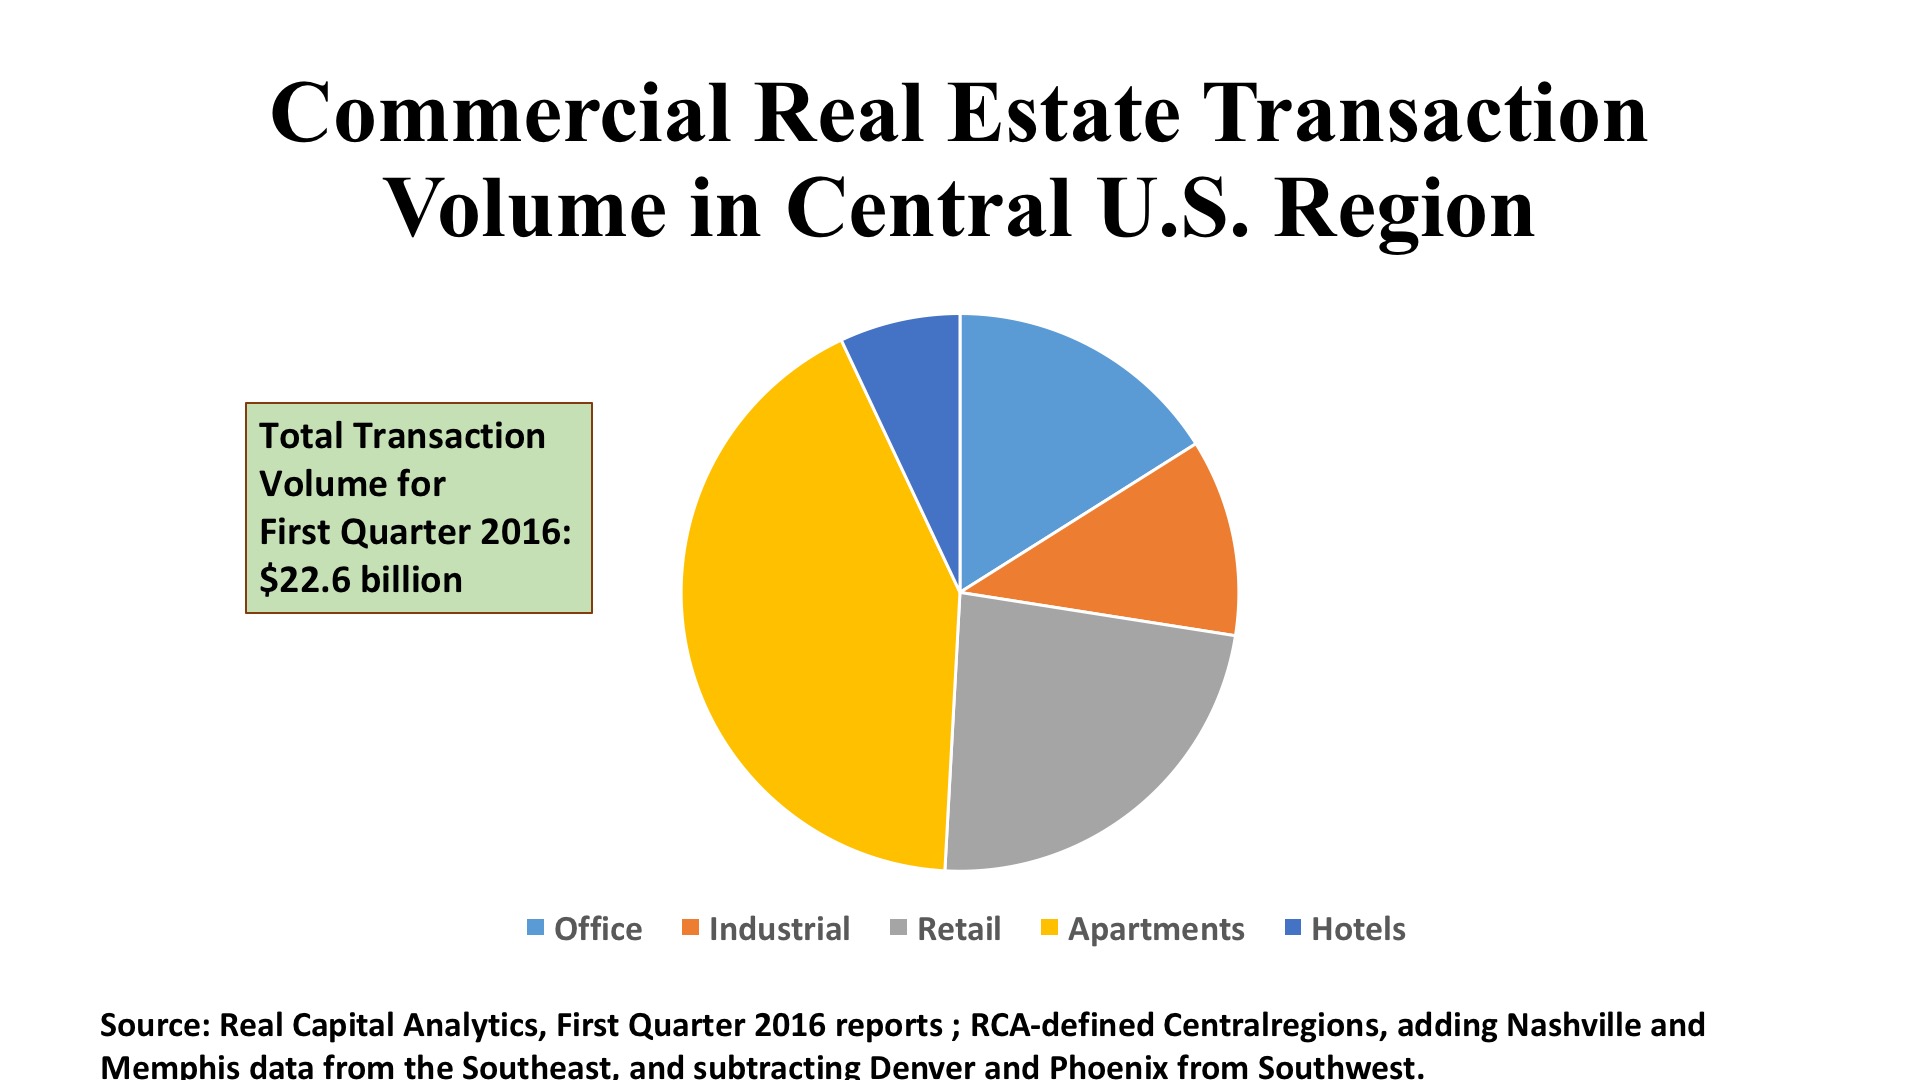
Office. Investment flows to Central Region offices were rather meager in the First Quarter 2016, amounting to only $3.6 billion in 311 individual transactions. No one market in the region posted more than $800 million in office deals. By contrast, there were seven markets elsewhere in the country that each saw between $1 billion (Philadelphia) and $5.7 billion (Manhattan) in office acquisitions in the first three months of the year. Average prices per square foot were just $137, about half of the US average of $266, and cap rates were elevated at 7.6%, versus the national standard of 6.5%.
Chicago did tally one of the 25 largest deals of the quarter, with a Caisse de Depot purchase of 180 LaSalle Street for $198 million, or 258 per square foot. Dallas matched Chicago in having the region’s highest deal count for the quarter, with 41 transactions, these generated just $622 million in total volume, versus Chicago’s $780 million. Investment was widely dispersed among the region’s remaining markets, with 69 of the region’s 287 office transactions (24%) occurring in locations classified as “tertiary” by Real Capital Analytics. By contrast, only 18% of the Atlantic Coast’s transactions were in tertiary markets and just 13% of the Western Region’s deals were so categorized.
Industrial. Warehouse, distribution, and flex deals slowed in the First Quarter for the Central Region. Where the full year 2015 figures showed this part of the country capturing 27.5% of US dollar volume for this property type, the market share dropped to 20.3%, based on a regional investment total of $2.57 billion, spread over 313 individual transactions. Nearly half the industrial dollar volume was directed to four key markets: Chicago, Indianapolis, Dallas, and Houston. Some 31% of the deals occurred in tertiary markets, and this is reflected in the region’s above-8% average cap rate, significantly above the US norm of 7.2 for industrial properties.
Institutional investors are doing selective purchases, attracted by current yields in established distribution markets. Prudential and CBRE Global Investors both made acquisitions which ranked among the top 20 industrial deals of the First Quarter, while Trammell Crow and Clarion Partners were buyers in recent deals in the $12 - $20 million range. On balance, though, the macro-economic drags of lower freight volumes, the strong dollar’s pressures on export industries, and the slump in the energy sector weigh heavily on industrial properties in the 20 states making up this region.
Retail. By comparison with office and industrial properties, the Central States did well in the shopping center investment category in early 2016. The region registered $5.36 billion in retail property deals, a full 30% of the transaction volume for this property type. Employment gains in the upper Midwest (392,000 combined from Ohio, Michigan, Indiana, Illinois, Wisconsin and Minnesota) are clearly a spur to consumer spending, and this has not been lost on merchants and retail property specialists. Chicago, in particular, had an excellent quarter, garnering $1.5 billion from 129 shopping property transactions.
In fact, the northern half of the region saw more than three-quarters of the Central States’ retail investment volume, and 71% of its deal count. The upper Midwest saw its retail investment volume grow by 15% compared with the same quarter last year, while the southern half of the region found its acquisition volume shrinking by 27%, reflecting both actual job losses in some states and decreasing confidence in major energy-based cities. Nevertheless, the first three months of 2016 did see significant purchases by established players, like O’Connor Capital Partners’ $200 million deal for the Shops at Canal Place (New Orleans) and Walton Street Capital’s $194 million buy of the Legends Outlet mall in Kansas City.